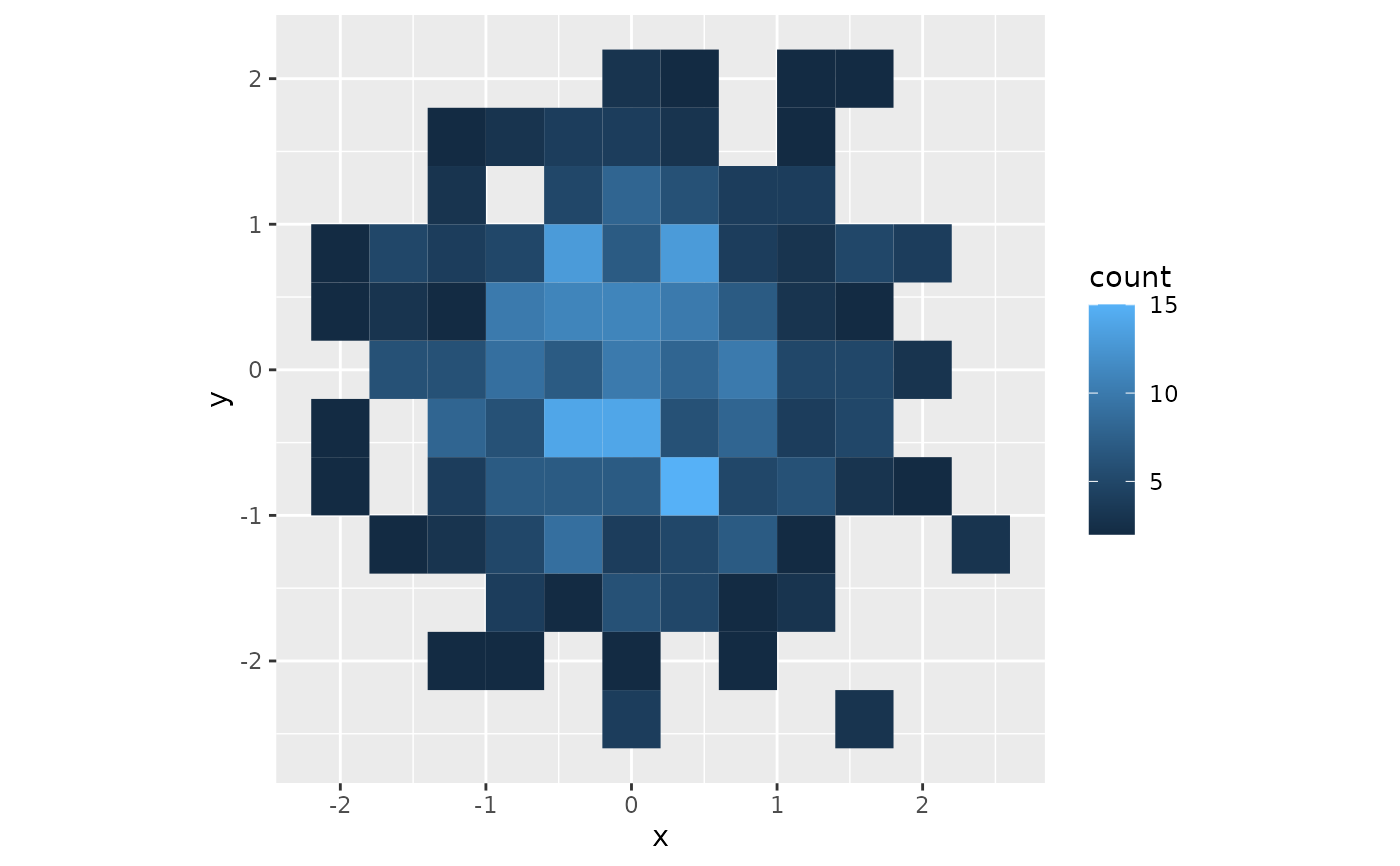
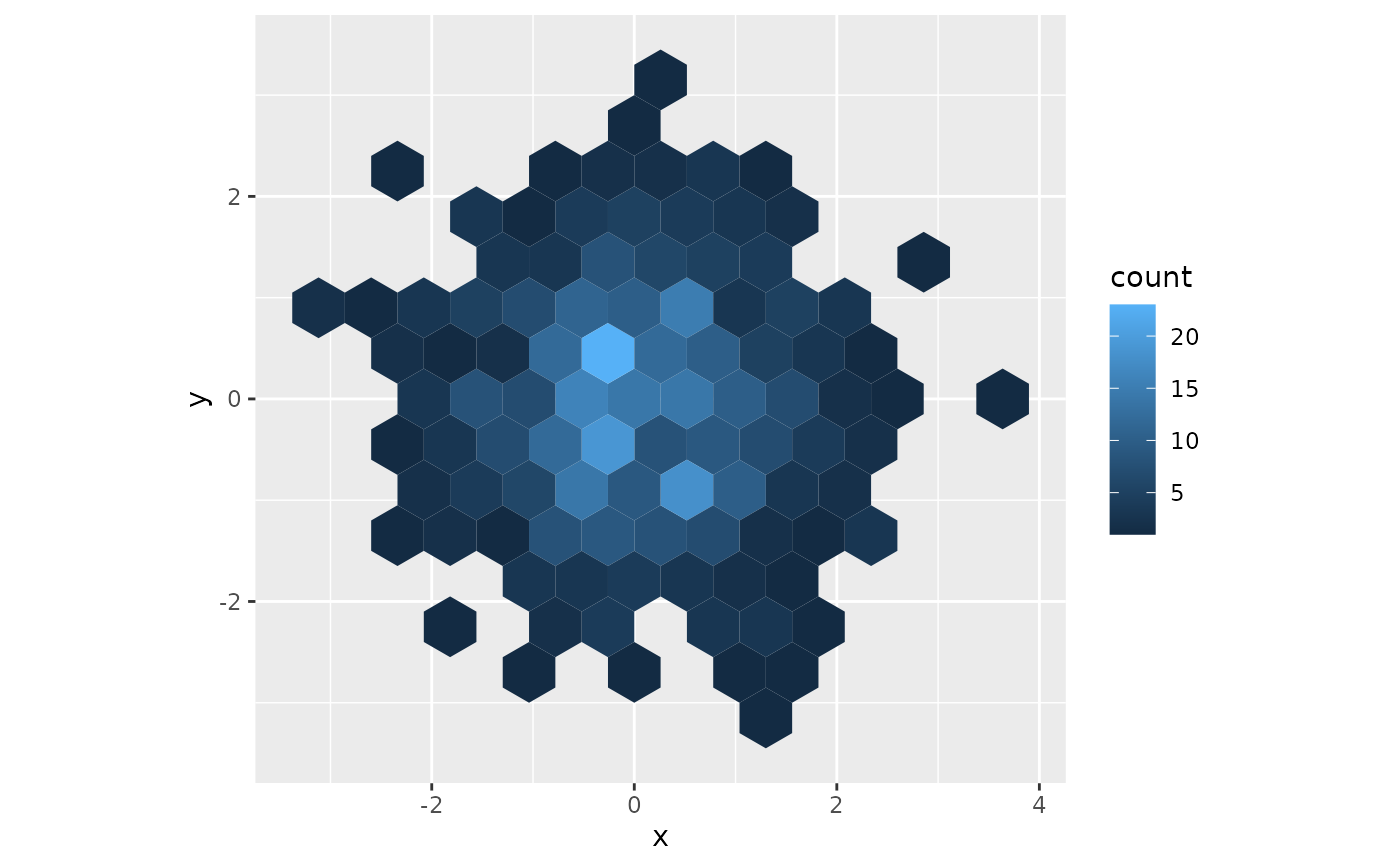
Bins x/y points into hexagons (shape = "hex", the default)
or squares (shape = "square") and draws each cell filled by its count.
The cells are sdv_bins()'s, so they match sdvplot (Python) and
sdvplot-js. Sizes are in data units, so on a court from sdv_surface()
with sdv_court_coords()'s court_x / court_y (feet), radius = 1
is a 1-foot hexagon and side = 1.5 a 1.5-foot square. Map weight
(as in ggplot2::geom_hex()) to sum a value per cell, and fill by it
with aes(fill = after_stat(weight)).
Usage
geom_sdv_bins(
  mapping = NULL,
  data = NULL,
  position = "identity",
  ...,
  shape = "hex",
  radius = NULL,
  side = NULL,
  equal_area = FALSE,
  origin = c(0, 0),
  cell_fill = NULL,
  min_count = 1,
  na.rm = FALSE,
  show.legend = NA,
  inherit.aes = TRUE
)
Arguments
- mapping, data, position, na.rm, show.legend, inherit.aes
As in
ggplot2::geom_polygon().xandyare required;weightis optional.- ...
Other arguments passed on to
ggplot2::layer(), such ascolour,linewidthoralphaset to a value.- shape
"hex"(the default) or"square".- radius
The hexagons' circumradius; for squares, with
equal_area = TRUE, the circumradius of the hexagon whose area each square has.- side
The squares' side.
- equal_area
For squares: size them by
radiusto the area of a hexagon of that circumradius, so a hex chart and a square chart of the same data have cells of the same area.- origin
The point a cell is centered on,
c(x, y)in the points' units: a hoop-centered lattice, origin = the basket's coordinates. The defaultc(0, 0)centers a cell on the data origin.- cell_fill
The drawn cell's size as a fraction of the lattice cell's, a number in (0, 1];
NULL(the default) is 0.88 for squares and 1 for hexagons. sdvplot'sfill.- min_count
Cells with fewer points than this are not drawn (default 1, every cell);
min_count = 2draws no single attempts.
Details
Unlike ggplot2::geom_hex(), whose cells stretch with the axes,
these are true hexagons and squares in data space, sized by radius or
side rather than a bin count: under ggplot2::coord_fixed() (as
sdv_surface() draws) they look regular. The lattice has a cell centered
on origin, by default the data origin (center court on an
sdv_surface() court); for a hoop-centered lattice, set origin to the
basket's coordinates.
cell_fill draws each cell at a fraction of the lattice cell, around its
center: by default 0.88 for squares, so neighboring squares keep a gap
instead of touching edge to edge, and 1 for hexagons, the conventional
tiled hexbin look. (sdvplot (Python) calls it fill; here fill is the
aesthetic.) The cells, their counts and the scales are the lattice's
whatever cell_fill is.
min_count leaves out cells with fewer points: min_count = 2 on a shot
chart draws no single attempts, which otherwise clutter its perimeter.
It only filters what is drawn: density is still each cell's share of
all the group's points, and sdv_bins() returns every cell.
Each group is binned on its own; facets bin each panel's data. Binning
happens after the position scales transform x and y, so under a
transformed scale (scale_x_log10()) the sizes and origin are in the
transformed units, as ggplot2::geom_hex()'s binwidth is.
Computed variables
after_stat(count): points in the cell (the defaultfill).after_stat(weight): the sum of the cell's points'weightaesthetic (a missing or non-finite weight counts 0); itscountwhenweightis not mapped.after_stat(density): the cell's share of its group's weight (of its points whenweightis not mapped);NaNwhen the group's weights sum to 0.after_stat(cell_id): the cell's id,"x,y"(sdv_bins()).
Linking cells and points in plotly
plotly::ggplotly() draws the cells, and links them to their points
without Shiny through plotly's crosstalk support: give the points their
cell id with sdv_bin_ids() (same shape, size and origin), make the
plot's data a plotly::highlight_key() keyed by it, and call
plotly::highlight(). Each cell's polygon carries its cell id as its
plotly key, so clicking a cell highlights its points, and clicking a
point lights its cell and cell-mates. This needs the default tooltip:
plotly then draws each cell as its own trace, which a click selects
whole.
d$cell_id <- sdv_bin_ids(d$x, d$y, radius = 0.3)
p <- ggplot(plotly::highlight_key(d, ~cell_id), aes(x, y)) +
  geom_sdv_bins(radius = 0.3, alpha = 0.7) +
  geom_point(size = 0.5) +
  coord_fixed()
plotly::highlight(plotly::ggplotly(p), on = "plotly_click", off = "plotly_doubleclick")
See also
geom_sdv_bins_interactive() to link each cell to its points.
Examples
library(ggplot2)
set.seed(1)
d <- data.frame(x = rnorm(500), y = rnorm(500))
ggplot(d, aes(x, y)) +
geom_sdv_bins(radius = 0.3) +
coord_fixed()
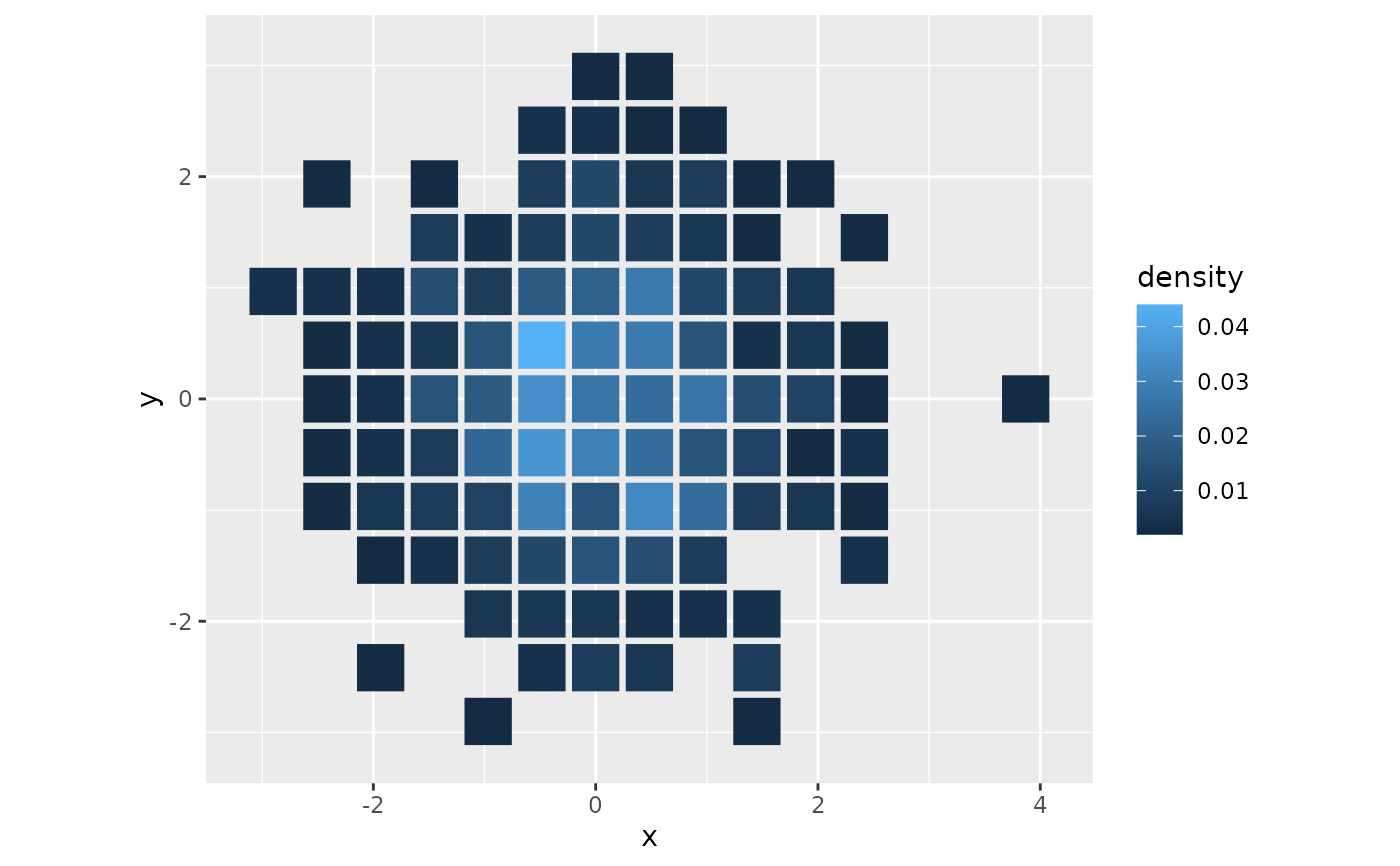
 ggplot(d, aes(x, y)) +
geom_sdv_bins(aes(fill = after_stat(density)),
shape = "square", radius = 0.3, equal_area = TRUE
) +
coord_fixed()
 # touching squares, and no single-point cells
ggplot(d, aes(x, y)) +
geom_sdv_bins(shape = "square", side = 0.4, cell_fill = 1, min_count = 2) +
coord_fixed()