
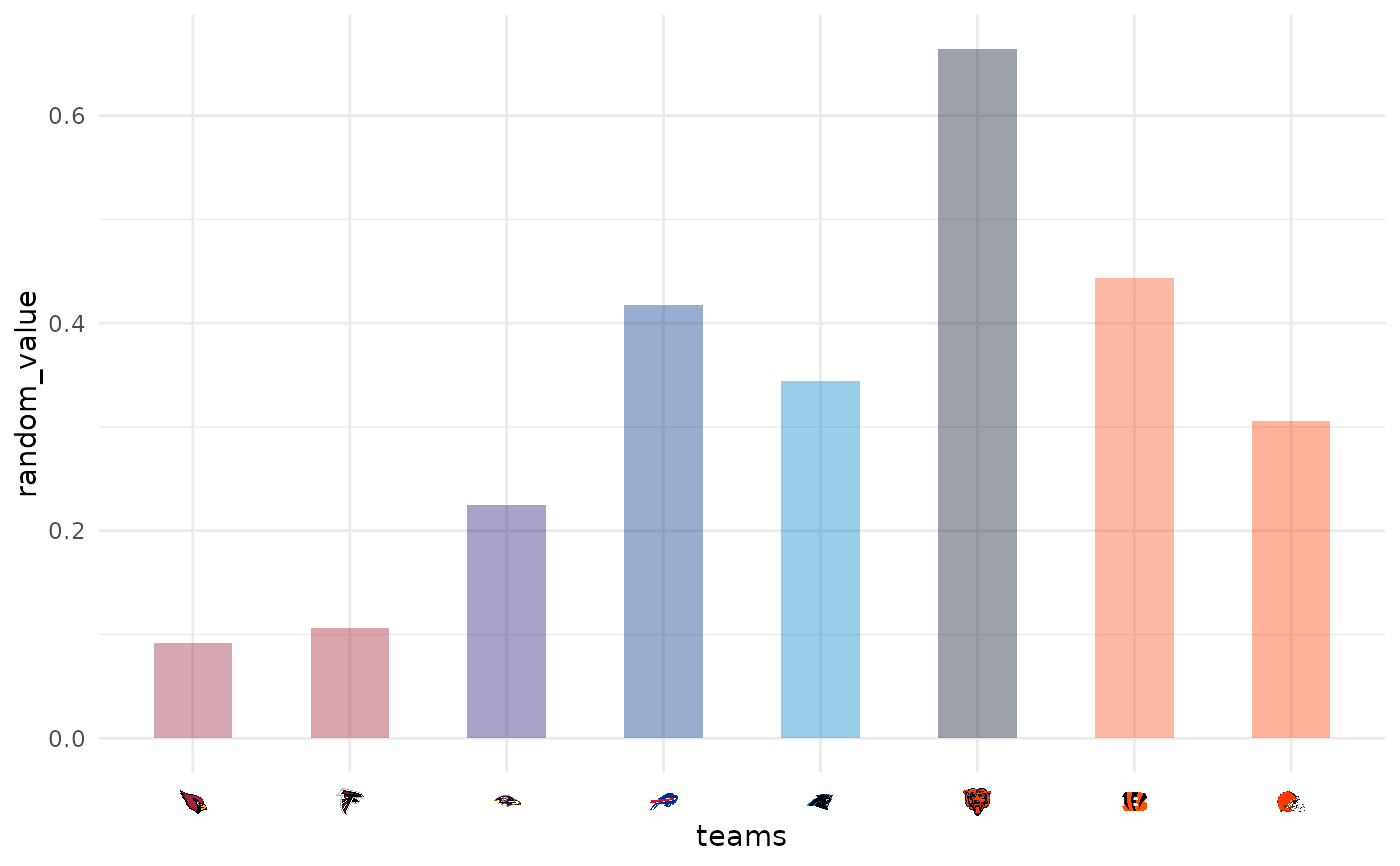
These scale functions replace axis labels with team logos or player headshots. They work by modifying the axis text theme element to render images.
Usage
scale_x_sdv(
  ...,
  sport = c("nfl", "nba", "wnba", "mlb", "nhl", "cfb", "mbb", "wbb"),
  expand = ggplot2::waiver(),
  guide = ggplot2::waiver(),
  position = "bottom",
  size = 12
)

scale_y_sdv(
  ...,
  sport = c("nfl", "nba", "wnba", "mlb", "nhl", "cfb", "mbb", "wbb"),
  expand = ggplot2::waiver(),
  guide = ggplot2::waiver(),
  position = "left",
  size = 12
)

scale_x_sdv_headshots(
  ...,
  sport = c("nfl", "nba", "wnba", "mlb", "nhl", "cfb", "mbb", "wbb"),
  expand = ggplot2::waiver(),
  guide = ggplot2::waiver(),
  position = "bottom",
  size = 20,
  id_type = NULL
)

scale_y_sdv_headshots(
  ...,
  sport = c("nfl", "nba", "wnba", "mlb", "nhl", "cfb", "mbb", "wbb"),
  expand = ggplot2::waiver(),
  guide = ggplot2::waiver(),
  position = "left",
  size = 30,
  id_type = NULL
)
Arguments
- ...
Other arguments passed to
ggplot2::scale_x_discrete()orggplot2::scale_y_discrete().- sport
Character string identifying the sport.
- expand
Expansion limits for the axis.
- guide
Guide for the axis.
- position
Position of the axis.
- size
The logo size in pixels. It is applied as height for an x-scale and as width for a y-scale.
- id_type
Which ID system the player IDs hold:
NULL(the default; GSIS IDs for the NFL, ESPN athlete IDs otherwise),"espn"or"league"(NBA / WNBA StatsPERSON_ID, MLBAM, NHL API, GSIS). Seegeom_sdv_headshots().
Details
The scale translates team names into raw image HTML and places the
HTML as axis labels. Because of the way ggplots are constructed, it is
necessary to adjust the theme after calling this scale. This can be done
by calling theme_x_sdv() or theme_y_sdv() after any complete theme such
as ggplot2::theme_minimal(), which replaces every theme element. To set
the theme by hand, change the relevant axis.text and its position
children (axis.text.x.bottom, ...) to ggtext::element_markdown():
complete themes in 'ggplot2' 4 set those children themselves.
Examples
# \donttest{
library(sdvplotR)
library(ggplot2)
team_abbr <- valid_team_names("nfl")[1:8]
df <- data.frame(
random_value = runif(length(team_abbr), 0, 1),
teams = team_abbr
)
if (requireNamespace("ggtext", quietly = TRUE)) {
ggplot(df, aes(x = teams, y = random_value)) +
geom_col(aes(fill = teams), width = 0.5) +
scale_fill_sdv(sport = "nfl", alpha = 0.4) +
scale_x_sdv(sport = "nfl") +
theme_minimal() +
theme_x_sdv()
}
 # }
# }