

On this page
A table of numbers tells you the values. It does not tell you which ones stand out, where the line falls between one group and the next, or how far a row has moved. Three functions handle those jobs, and this article builds one table with each:
-
Percentile bars: the 2025 NFL season’s busiest
quarterbacks, each one’s EPA per dropback and completion percentage over
expected drawn against every qualified passer with
gt_percentile_bar(). -
Cut lines: the NBA’s 2025-26 Western Conference
standings, with
gt_cutline()marking where the playoff seeds end and where the play-in ends. -
Rank changes: the final 2025 college football AP
Top 25 with each team’s move since the preseason poll, computed and
colored by
gt_delta().
The quarterbacks come from nflverse’s player stats via nflreadr, the
standings from ESPN via hoopR and the
polls from CollegeFootballData.com via cfbfastR
(which needs a free API key). The three functions come from Andrew
Weatherman’s gtUtils, and the
first two sections follow his delay-table example.
1. Percentile bars
We take every quarterback with at least 250 dropbacks (pass attempts plus sacks) in the 2025 regular season and compute two rates: EPA per dropback and completion percentage over expected (CPOE). Each gets a percentile among all the qualified passers, so the fifteen busiest can be read against the whole group, not just against each other.
qbs <- nflreadr::load_player_stats(2025, summary_level = "reg") |>
  filter(position == "QB") |>
  mutate(dropbacks = attempts + sacks_suffered, epa_db = passing_epa / dropbacks) |>
  filter(dropbacks >= 250) |>
  mutate(
    epa_ptile = cume_dist(epa_db),
    cpoe_ptile = cume_dist(passing_cpoe)
  ) |>
  arrange(desc(dropbacks), player_id) |>
  slice_head(n = 15) |>
  select(player_id, player_display_name, recent_team, dropbacks, epa_db, epa_ptile, passing_cpoe, cpoe_ptile)
cume_dist() gives each value’s percentile, on a 0-1
scale, which matters in a moment. Sorting on player_id
after dropbacks breaks any tie the same way on every
rebuild.
gt_percentile_bar() turns each percentile column into a
filled track with a numbered marker at the tip.
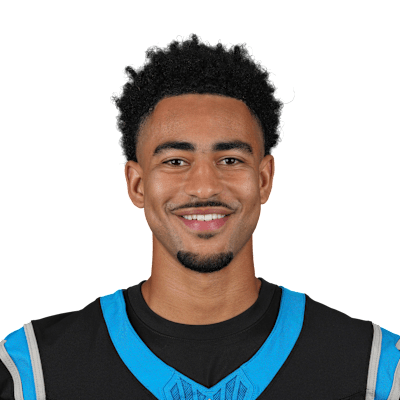
gt_sdv_headshots() turns the GSIS ids into NFL.com
headshots and gt_sdv_logos() the team abbreviations into
logos.
qbs |>
  gt(id = "qb-bars") |>
  gt_theme_almanac() |>
  gt_sdv_headshots(player_id, league = "nfl", id_system = "gsis", height = 34) |>
  gt_sdv_logos(recent_team, league = "nfl", height = 24) |>
  gt_percentile_bar(c(epa_ptile, cpoe_ptile), full_track = FALSE, width = 150) |>
  fmt_number(epa_db, decimals = 2, force_sign = TRUE) |>
  fmt_number(passing_cpoe, decimals = 1, force_sign = TRUE) |>
  tab_spanner(columns = c(epa_db, epa_ptile), "EPA per dropback") |>
  tab_spanner(columns = c(passing_cpoe, cpoe_ptile), "CPOE") |>
  cols_align(columns = -player_display_name, "center") |>
  gt_add_divider(dropbacks, color = "black", weight = px(1.5), include_labels = FALSE) |>
  cols_label(
    player_id = "", player_display_name = "Quarterback", recent_team = "",
    dropbacks = "Dropbacks", epa_db = "Value", epa_ptile = "Percentile",
    passing_cpoe = "Value", cpoe_ptile = "Percentile"
  ) |>
  tab_footnote(
    locations = cells_column_spanners(),
    footnote = "Percentile among every quarterback with at least 250 dropbacks in the 2025 regular season"
  ) |>
  tab_header(
    "The NFL's busiest passers, 2025",
    "The 15 quarterbacks with the most dropbacks, regular season"
  ) |>
tab_source_note("Data: nflverse player stats via nflreadr")| The NFL's busiest passers, 2025 | |||||||
| The 15 quarterbacks with the most dropbacks, regular season | |||||||
| Quarterback | Dropbacks |
EPA per dropback1
|
CPOE1
|
||||
|---|---|---|---|---|---|---|---|
| Value | Percentile | Value | Percentile | ||||
 |
Bo Nix |  |
634 | +0.10 | 61
|
−1.2 | 27
|
 |
Dak Prescott |  |
631 | +0.18 | 88
|
+2.2 | 70
|
 |
Matthew Stafford |  |
620 | +0.24 | 97
|
+1.5 | 48
|
 |
Jared Goff |  |
616 | +0.17 | 85
|
+1.8 | 64
|
 |
Trevor Lawrence |  |
601 | +0.06 | 52
|
−1.9 | 24
|
 |
Cam Ward |  |
595 | −0.18 | 6
|
−2.9 | 12
|
 |
Caleb Williams |  |
592 | +0.07 | 58
|
−3.5 | 9
|
 |
Baker Mayfield |  |
579 | +0.00 | 27
|
−2.1 | 21
|
 |
Justin Herbert |  |
566 | +0.03 | 39
|
+1.6 | 52
|
 |
Drake Maye |  |
539 | +0.31 | 100
|
+10.8 | 100
|
 |
Patrick Mahomes |  |
536 | +0.13 | 67
|
+0.3 | 36
|
 |
Jacoby Brissett |  |
528 | −0.01 | 21
|
+1.6 | 58
|
 |
Aaron Rodgers |  |
527 | +0.05 | 48
|
+0.0 | 33
|
 |
Bryce Young |  |
505 | −0.04 | 18
|
+1.0 | 45
|
 |
Sam Darnold |  |
504 | +0.15 | 79
|
+5.2 | 91
|
| 1 Percentile among every quarterback with at least 250 dropbacks in the 2025 regular season | |||||||
| Data: nflverse player stats via nflreadr | |||||||
The percentile columns are stored on a 0-1 scale, but the markers
read as whole numbers out of 100. That is
gt_percentile_bar()’s scale argument, which
defaults to "auto": a column whose values all fall in
[0, 1] is treated as a proportion and mapped onto the 0-100
axis, so a raw 0.71 prints as 71. A column
already on a 0-100 scale is left alone, so the same code works either
way. Set scale = "none" to turn that off.
The other arguments cover the look:
-
domain: the value range the bar spans,c(0, 100)by default. -
palette: colors mapped across the domain, used for both the fill and the marker. The default runs blue at the low end through grey to red at the high end. -
full_track: whether the unfilled track runs the full width or stops at the marker. We set it toFALSEso each bar ends at its own value. -
width,marker_size,track_height,text_color,decimals: the column width, the marker, the thickness of the track, the color of the number inside the marker, and its decimal places. -
na_label: what to show for a missing percentile. It defaults to an em dash and draws a broken track, so an empty row cannot be misread as a percentile of zero.
The whole bar is CSS, not an image, so it stays sharp at any export size.
2. Cut lines
The second table asks where the lines fall in a standings table. In the NBA, seeds 1-6 in each conference go straight to the playoffs, seeds 7-10 play in for the last two places, and the rest go to the lottery. ESPN’s standings carry each team’s final seed, tiebreakers and the play-in applied, so the 7 and 8 seeds are the two play-in winners and the 8 seed can hold the better record.
nba_teams <- sdv_teams("nba")

west <- hoopR::espn_nba_standings(year = 2026) |>
  mutate(
    team_id = as.character(team_id),
    conference = nba_teams$conference[match(team_id, nba_teams$team_id)],
    abbr = nba_teams$abbr[match(team_id, nba_teams$team_id)]
  ) |>
  filter(conference == "Western Conference") |>
  arrange(playoffseed) |>
  transmute(
    seed = playoffseed, team = abbr, wins, losses,
    pct = winpercent, diff = as.numeric(differential), last_ten = lasttengames
  )
sdv_teams() gives each ESPN team id its conference and
abbreviation; ESPN’s standings leave the conference out.
west |>
  gt(id = "west") |>
  gt_theme_almanac(accent = "#1D428A") |>
  gt_sdv_logos(team, league = "nba", height = 24) |>
  gt_cutline(after = 0, "Playoffs", color = "#1D428A") |>
  gt_cutline(after = 6, "Play-in", color = "#C8102E", gap = c(12, 0)) |>
  gt_cutline(after = 10, "Lottery", color = "#5A5A5A", gap = c(12, 0)) |>
  opt_row_striping(FALSE) |>
  fmt(pct, fns = function(x) sub("^0", "", sprintf("%.3f", x))) |>
  fmt_number(diff, decimals = 1, force_sign = TRUE) |>
  cols_label(
    seed = "Seed", team = "", wins = "W", losses = "L", pct = "Pct",
    diff = "Diff", last_ten = "Last 10"
  ) |>
  cols_align(columns = everything(), "center") |>
  tab_style(locations = cells_body(), style = cell_text(size = px(14))) |>
  tab_header(
    "Western Conference standings, 2025-26",
    "Regular-season records; final seeds, after the play-in. Diff is the average scoring margin."
  ) |>
  gt_538_caption(
    "Seeds 1-6 reach the playoffs; seeds 7-10 meet in the play-in for the last two places.",
    "Data: ESPN standings via hoopR"
)| Western Conference standings, 2025-26 | ||||||
| Regular-season records; final seeds, after the play-in. Diff is the average scoring margin. | ||||||
| Seed1 | 1 | W1 | L1 | Pct1 | Diff1 | Last 101 |
|---|---|---|---|---|---|---|
| 1 |  |
64 | 18 | .780 | +11.1 | 7-3 |
| 2 |  |
62 | 20 | .756 | +8.3 | 8-2 |
| 3 |  |
54 | 28 | .659 | +5.2 | 10-0 |
| 4 |  |
53 | 29 | .646 | +1.7 | 7-3 |
| 5 |  |
52 | 30 | .634 | +5.2 | 9-1 |
| 6 |  |
49 | 33 | .598 | +3.4 | 5-5 |
| 7 |  |
42 | 40 | .512 | −0.3 | 7-3 |
| 8 |  |
45 | 37 | .549 | +1.5 | 5-5 |
| 9 |  |
42 | 40 | .512 | +1.2 | 6-4 |
| 10 |  |
37 | 45 | .451 | −0.6 | 3-7 |
| 11 |  |
26 | 56 | .317 | −4.5 | 1-9 |
| 12 |  |
26 | 56 | .317 | −5.5 | 3-7 |
| 13 |  |
25 | 57 | .305 | −6.0 | 1-9 |
| 14 |  |
22 | 60 | .268 | −10.0 | 3-7 |
| 15 |  |
22 | 60 | .268 | −8.4 | 1-9 |
| 1 Seeds 1-6 reach the playoffs; seeds 7-10 meet in the play-in for the last two places. | ||||||
| Data: ESPN standings via hoopR | ||||||
There are three cut lines, one per group.
gt_cutline(after = 6, ...) draws the rule between rows 6
and 7, where the playoff seeds give way to the play-in, and
after = 10 does the same where the play-in ends. Each label
sits on its line, rendered in uppercase.
The first call, gt_cutline(after = 0, ...), is the
useful trick: after = 0 draws a line above the very first
row, which labels the top section the same way the others are
labelled.
A few arguments shape the lines:
-
color,weight,style: the color, thickness, and line style ("dashed","solid", or"dotted"). -
label,label_position,label_size,label_color: the text on the line, whether it sits above or below, and how it looks. -
gap: extra space around the line, in pixels. A single number pads both sides; a length-2 vectorc(above, below)sets them separately. Heregap = c(12, 0)opens room above each lower line without pushing the row below it down.
Note cell_text(size = px(14)) on the body: the
gt_theme_* functions set their font sizes per cell, so
tab_options(table.font.size = ...) will not move them.
Restyle the body cells directly instead.
Cut lines are positional, not data-driven.
gt::tab_row_group() splits a table on a value in the data
and adds heading rows; a cut line leaves the table flowing and marks a
fixed row number, which is what a standings table wants.
3. Rank changes
The last table puts a final ranking next to where each team started.
The preseason AP poll is week 1 of the regular season in
CollegeFootballData.com’s rankings, and the final poll is the only poll
of the postseason. The polls need a CollegeFootballData.com key in
CFBD_API_KEY; without one, or once its monthly calls are
spent, this section’s code is shown but not run.
# a key with calls left this month (a margin for the articles built after this one): CFBD answers HTTP 429 with no rows once they are spent
has_key <- isTRUE(tryCatch(cfbfastR::cfbd_api_key_info()$remaining_calls > 10, error = function(e) FALSE))
ap_poll <- function(...) {
  cfbfastR::cfbd_rankings(year = 2025, ...) |>
    filter(poll == "AP Top 25") |>
    select(school, conference, rank)
}

preseason <- ap_poll(week = 1, season_type = "regular")
final <- ap_poll(season_type = "postseason")

moves <- final |>
  left_join(select(preseason, school, preseason = rank), by = "school") |>
  arrange(rank) |>
  select(rank, school, conference, preseason)
gt_delta(from, to) adds a column holding
to - from, signed and colored by direction. For a ranking,
a lower number is better, so passing the final rank as from
and the preseason rank as to gives the places a team
climbed: positive when it rose. A team that was unranked in the
preseason has no starting rank, so its change is left blank and its
preseason cell reads NR.
moves |>
  gt(id = "ap-moves") |>
  gt_theme_almanac(accent = "#9E1B32") |>
  gt_sdv_logos(school, league = "cfb", height = 22, include_name = TRUE) |>
  gt_delta(rank, preseason, column_label = "Places climbed", decimals = 0, arrows = TRUE) |>
  sub_missing(preseason, missing_text = "NR") |>
  cols_label(rank = "Final", school = "Team", conference = "Conference", preseason = "Preseason") |>
  cols_align(columns = -c(school, conference), "center") |>
  tab_style(locations = cells_body(), style = cell_text(size = px(14))) |>
  tab_header(
    "The final 2025 AP Top 25, and where each team started",
    "Final poll after the national championship, against the preseason poll"
  ) |>
tab_source_note("Data: CollegeFootballData.com via cfbfastR")| The final 2025 AP Top 25, and where each team started | ||||
| Final poll after the national championship, against the preseason poll | ||||
| Final | Team | Conference | Preseason | Places climbed |
|---|---|---|---|---|
| 1 |
 Indiana |
Big Ten | 20 | ▲ 19 |
| 2 |
 Miami |
ACC | 10 | ▲ 8 |
| 3 |
 Ole Miss |
SEC | 21 | ▲ 18 |
| 4 |
 Oregon |
Big Ten | 7 | ▲ 3 |
| 5 |
 Ohio State |
Big Ten | 3 | ▼ 2 |
| 6 |
 Georgia |
SEC | 5 | ▼ 1 |
| 7 |
 Texas Tech |
Big 12 | 23 | ▲ 16 |
| 8 |
 Texas A&M |
SEC | 19 | ▲ 11 |
| 9 |
 Alabama |
SEC | 8 | ▼ 1 |
| 10 |
 Notre Dame |
FBS Independents | 6 | ▼ 4 |
| 11 |
 BYU |
Big 12 | NR | |
| 12 |
 Texas |
SEC | 1 | ▼ 11 |
| 13 |
 Oklahoma |
SEC | 18 | ▲ 5 |
| 14 |
 Utah |
Big 12 | NR | |
| 15 |
 Vanderbilt |
SEC | NR | |
| 16 |
 Virginia |
ACC | NR | |
| 17 |
 Iowa |
Big Ten | NR | |
| 18 |
 Tulane |
American Athletic | NR | |
| 19 |
 James Madison |
Sun Belt | NR | |
| 20 |
 USC |
Big Ten | NR | |
| 21 |
 Michigan |
Big Ten | 14 | ▼ 7 |
| 22 |
 Houston |
Big 12 | NR | |
| 23 |
 Navy |
American Athletic | NR | |
| 24 |
 North Texas |
American Athletic | NR | |
| 25 |
 TCU |
Big 12 | NR | |
| Data: CollegeFootballData.com via cfbfastR | ||||
arrows = TRUE leads each value with a triangle in place
of a sign, so a fall reads as a down triangle in front of a positive
number. With percent = TRUE the change is shown as a
percent of from instead, which suits values such as points
or yards better than ranks.





Related SportsDataverse packages
- sdvplot - the Python plotting package
- sdvplot-js - the JavaScript / TypeScript plotting packages
- cfbfastR - college football
- hoopR - men’s basketball
- wehoop - women’s basketball
- baseballr - baseball
- fastRhockey - hockey
- oddsapiR - betting odds
- sportyR - playing surfaces
- sportsdataverse-py - the Python package
- sportsdataverse-R - the R meta-package