


On this page
Each picture links to its article. A plot is the figure that article draws when this site is built; an article built on tables shows a preview of a table theme from the package.
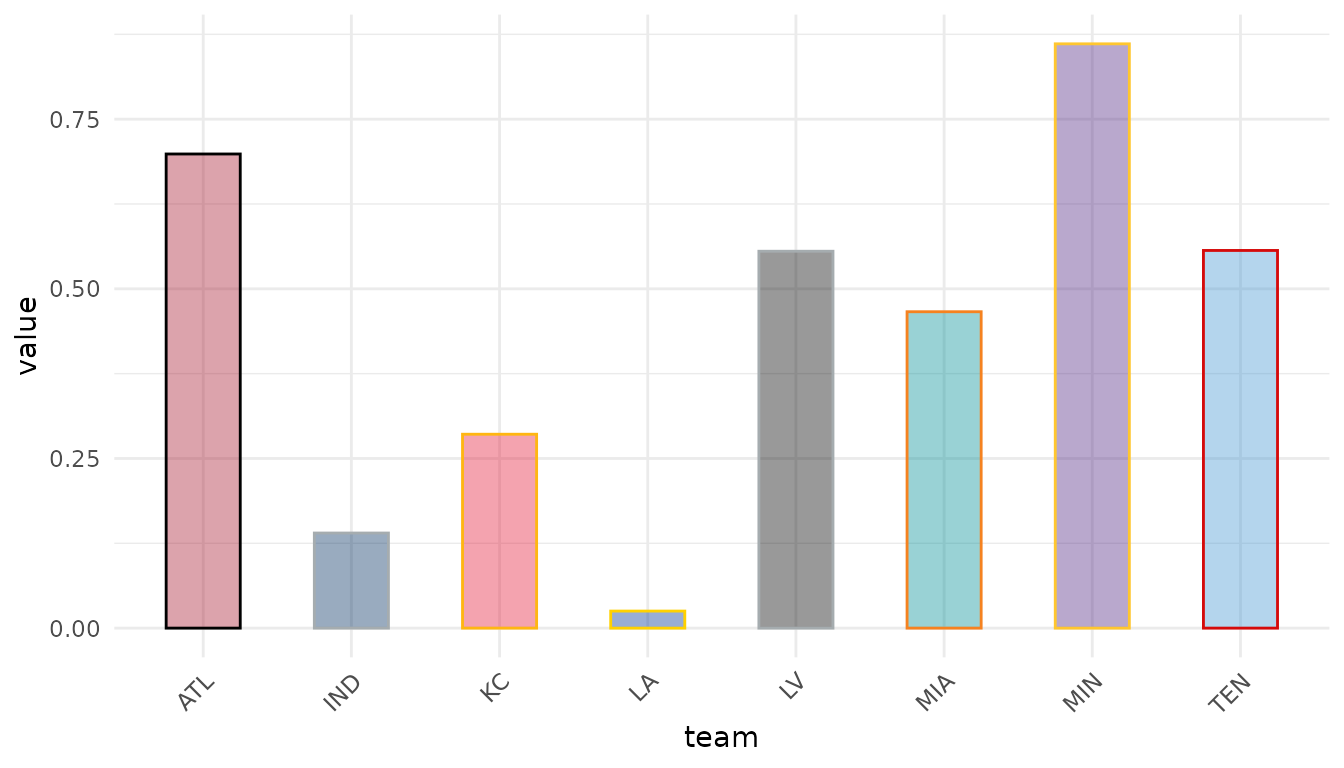 Getting Started
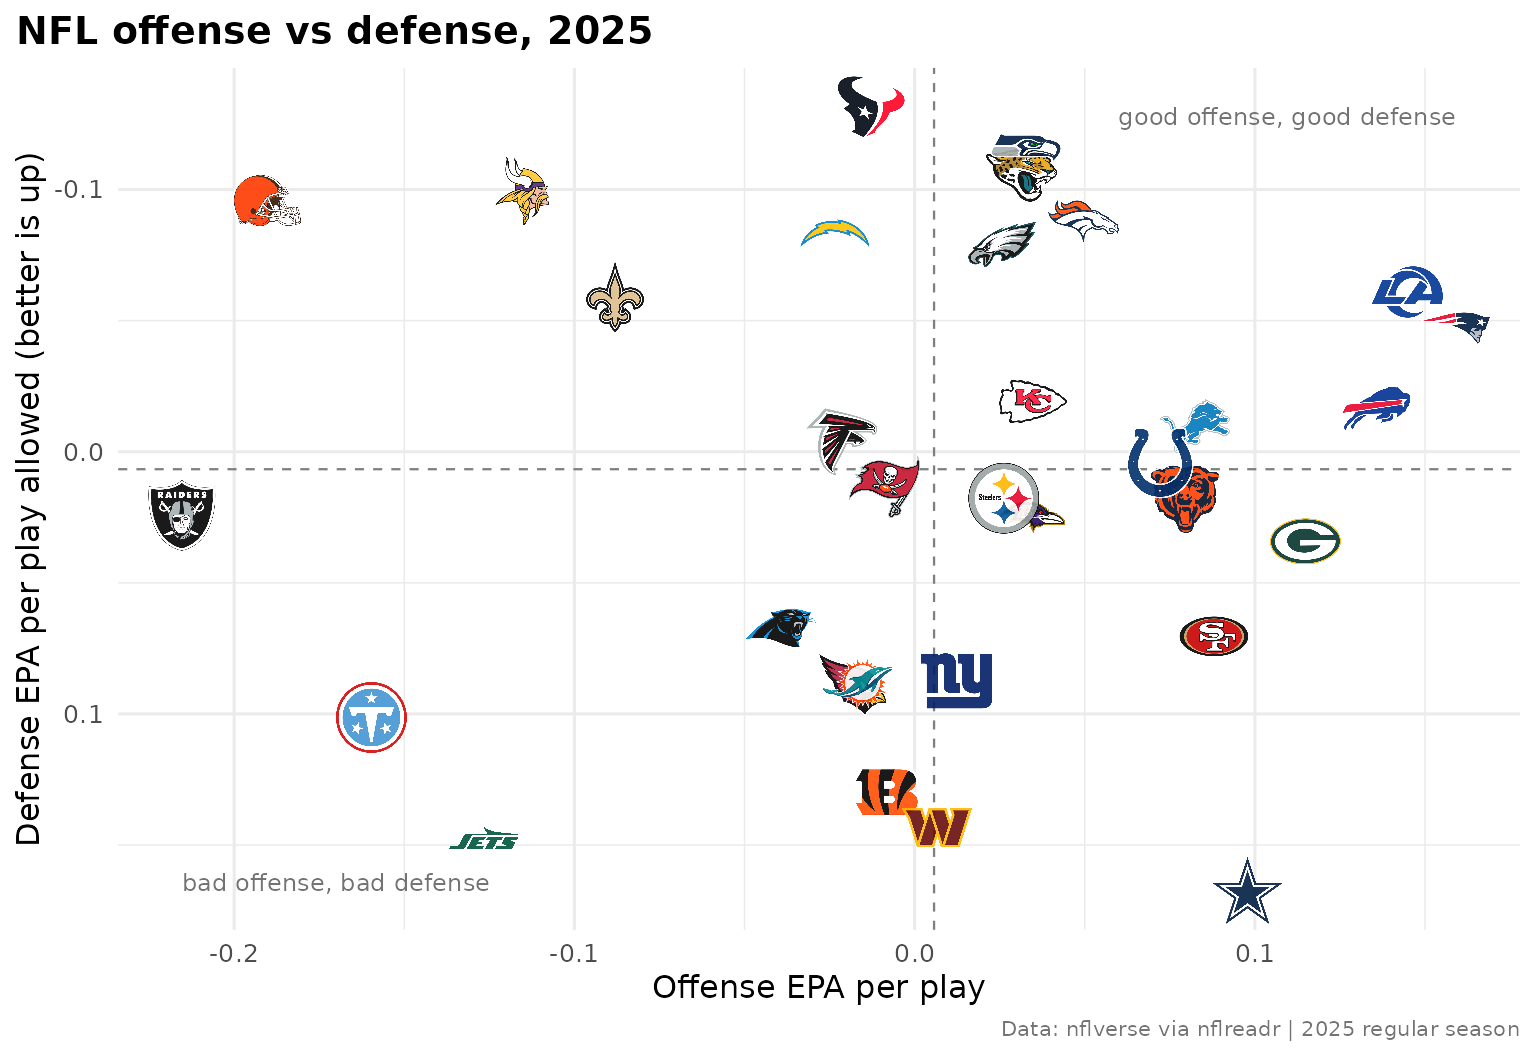 NFL
NFL
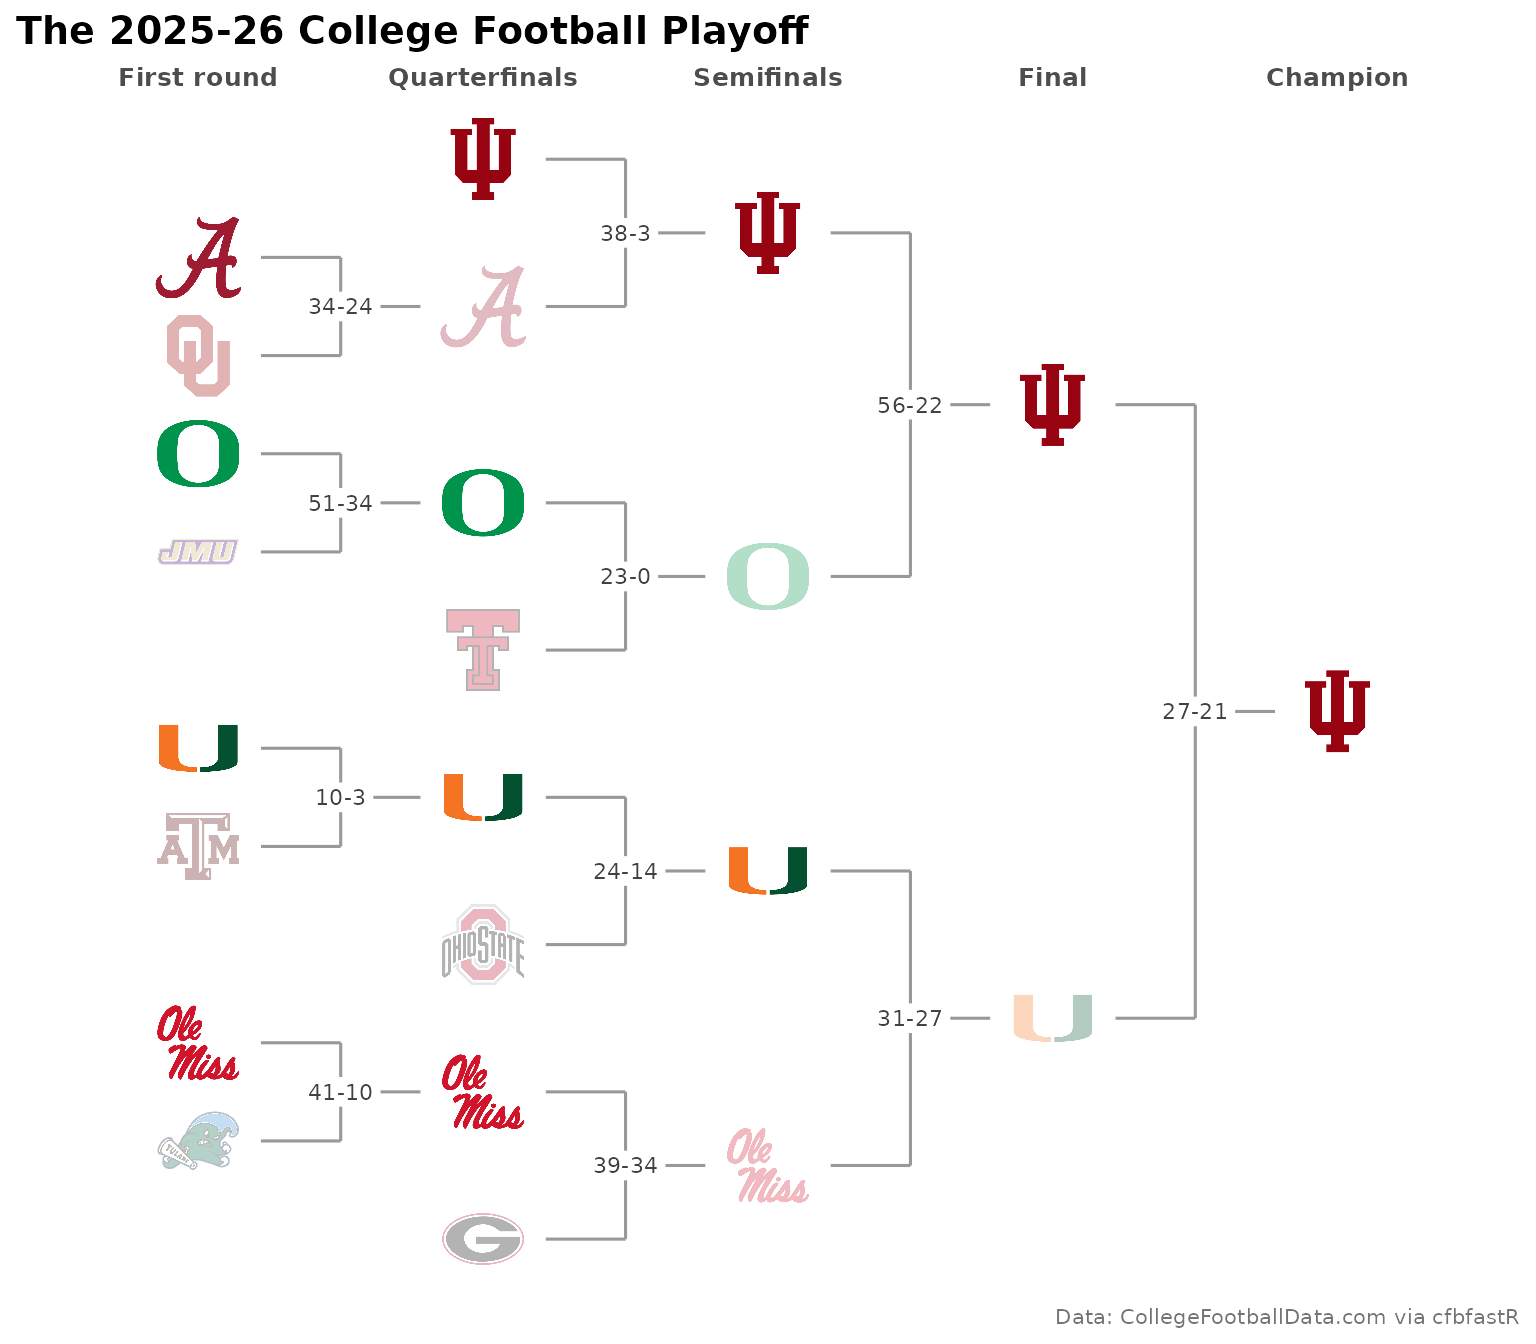 College Football
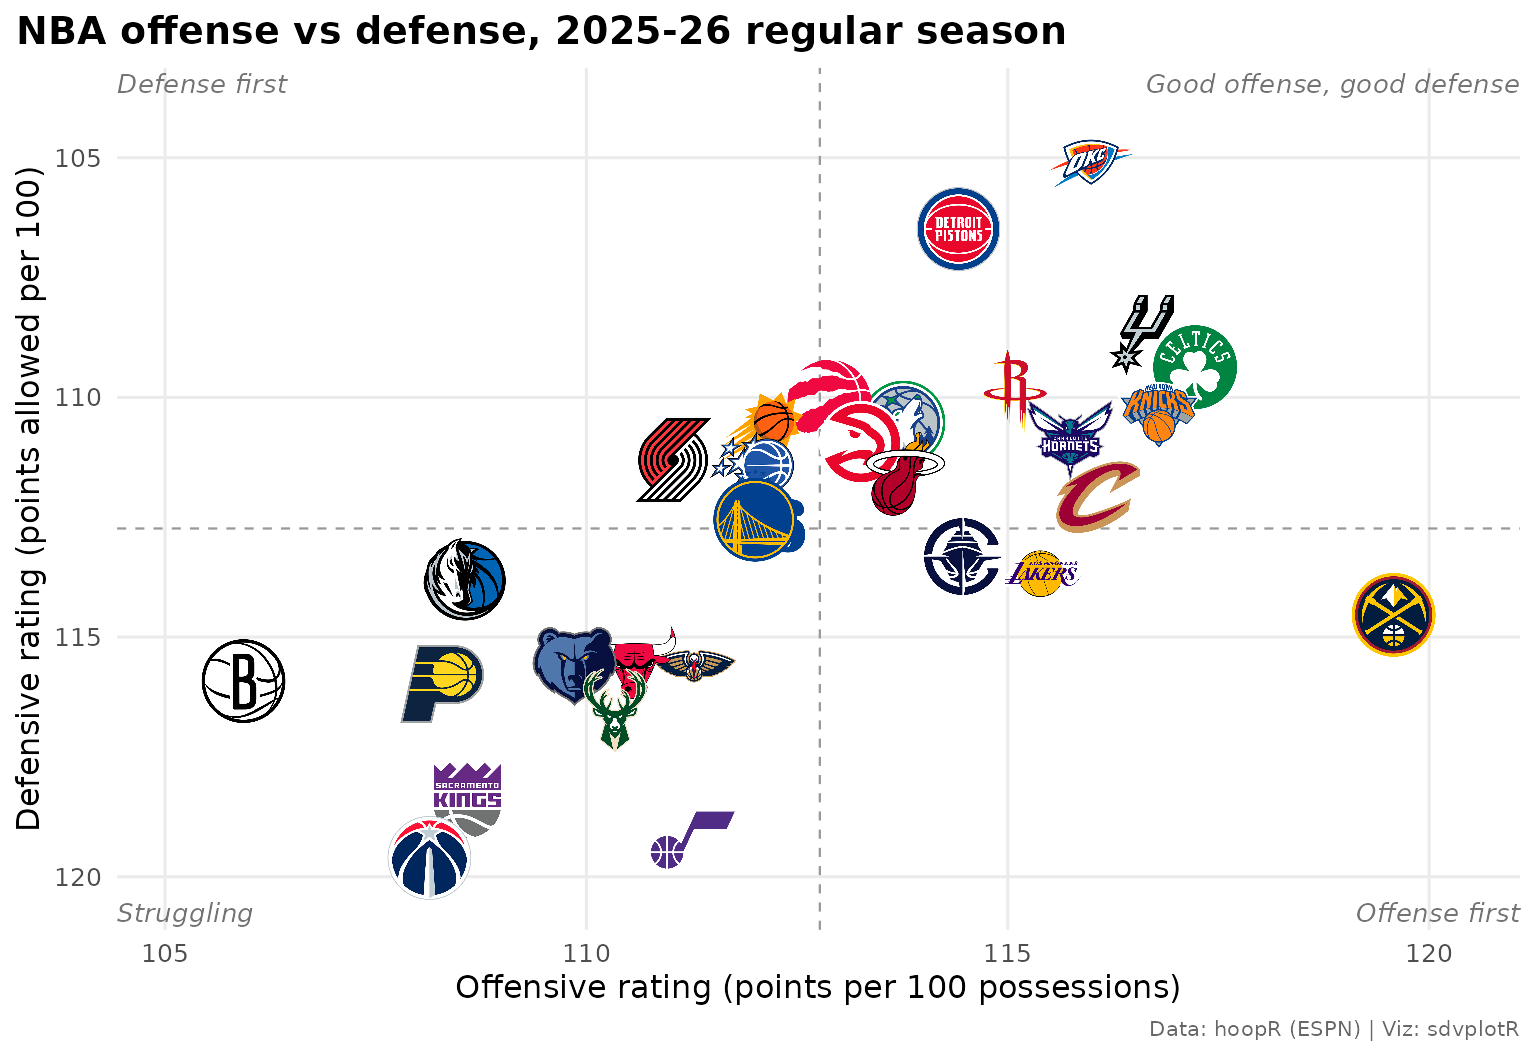 NBA
NBA
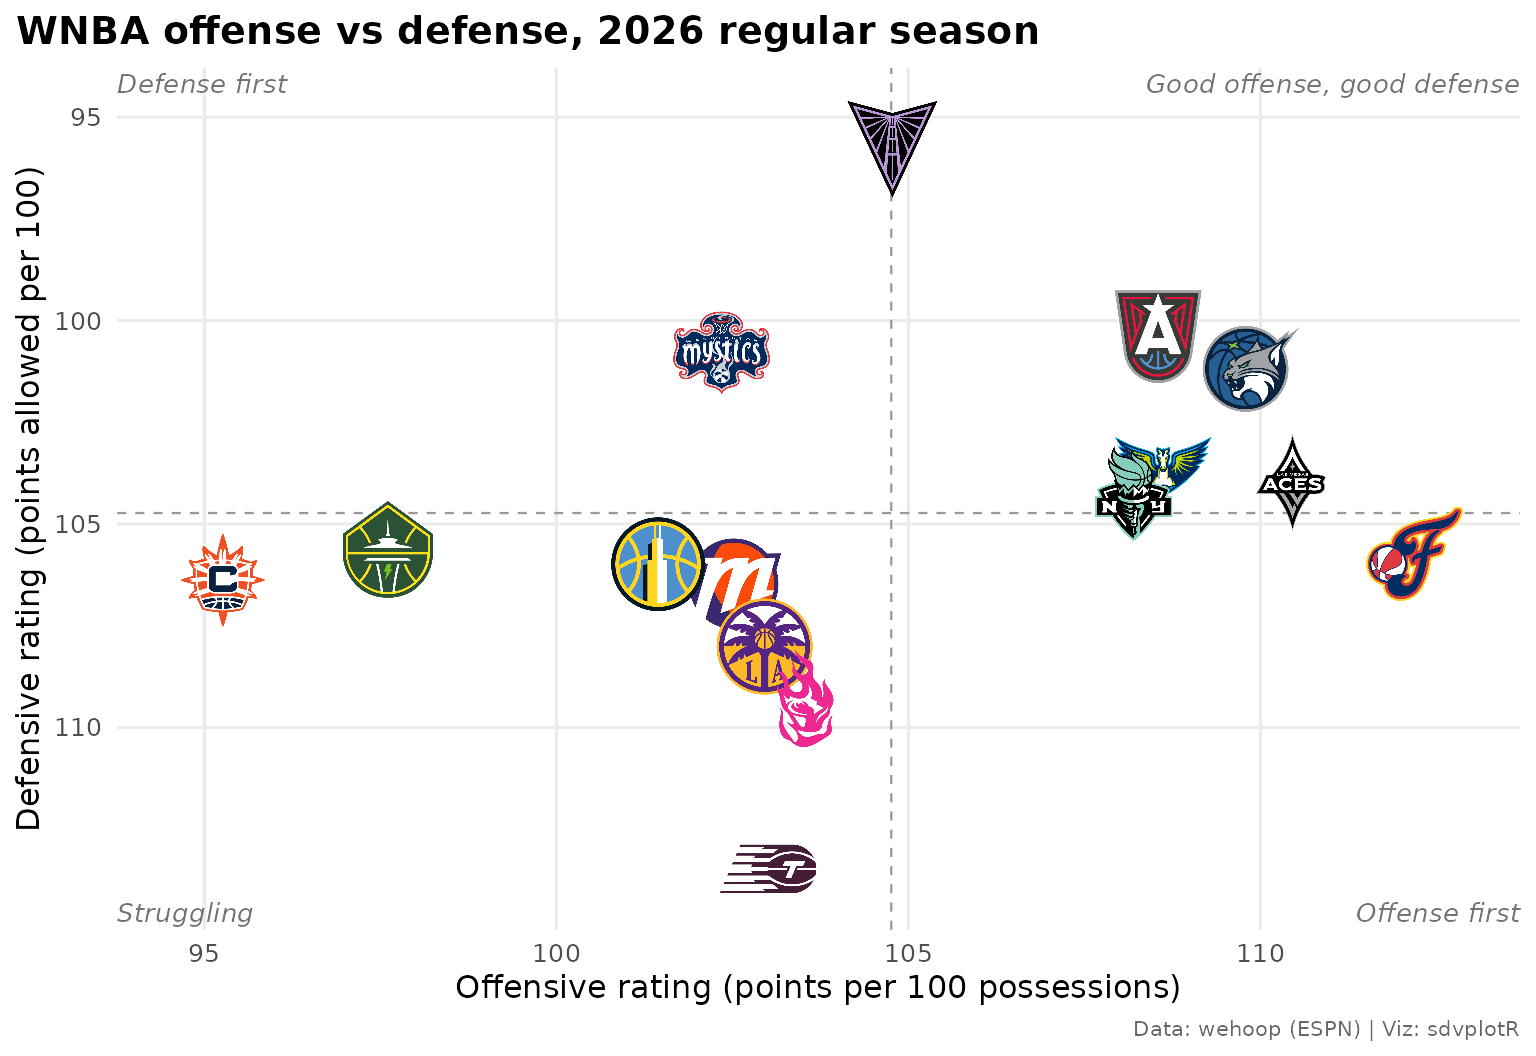 WNBA
WNBA
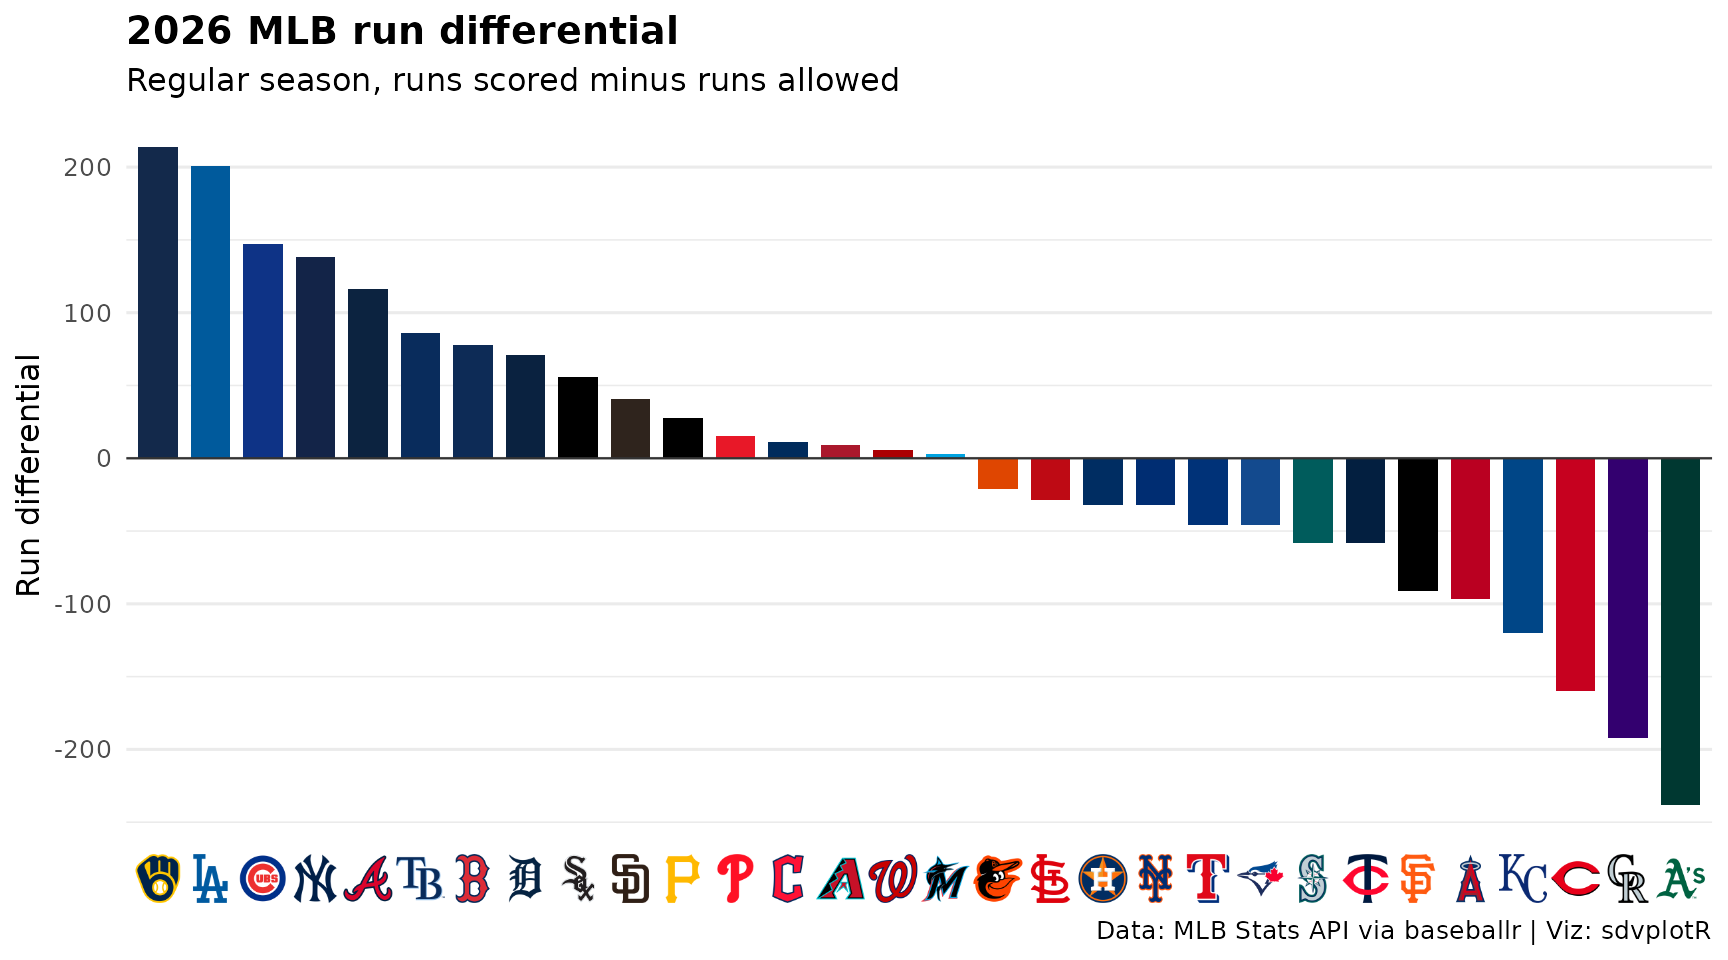 MLB
MLB
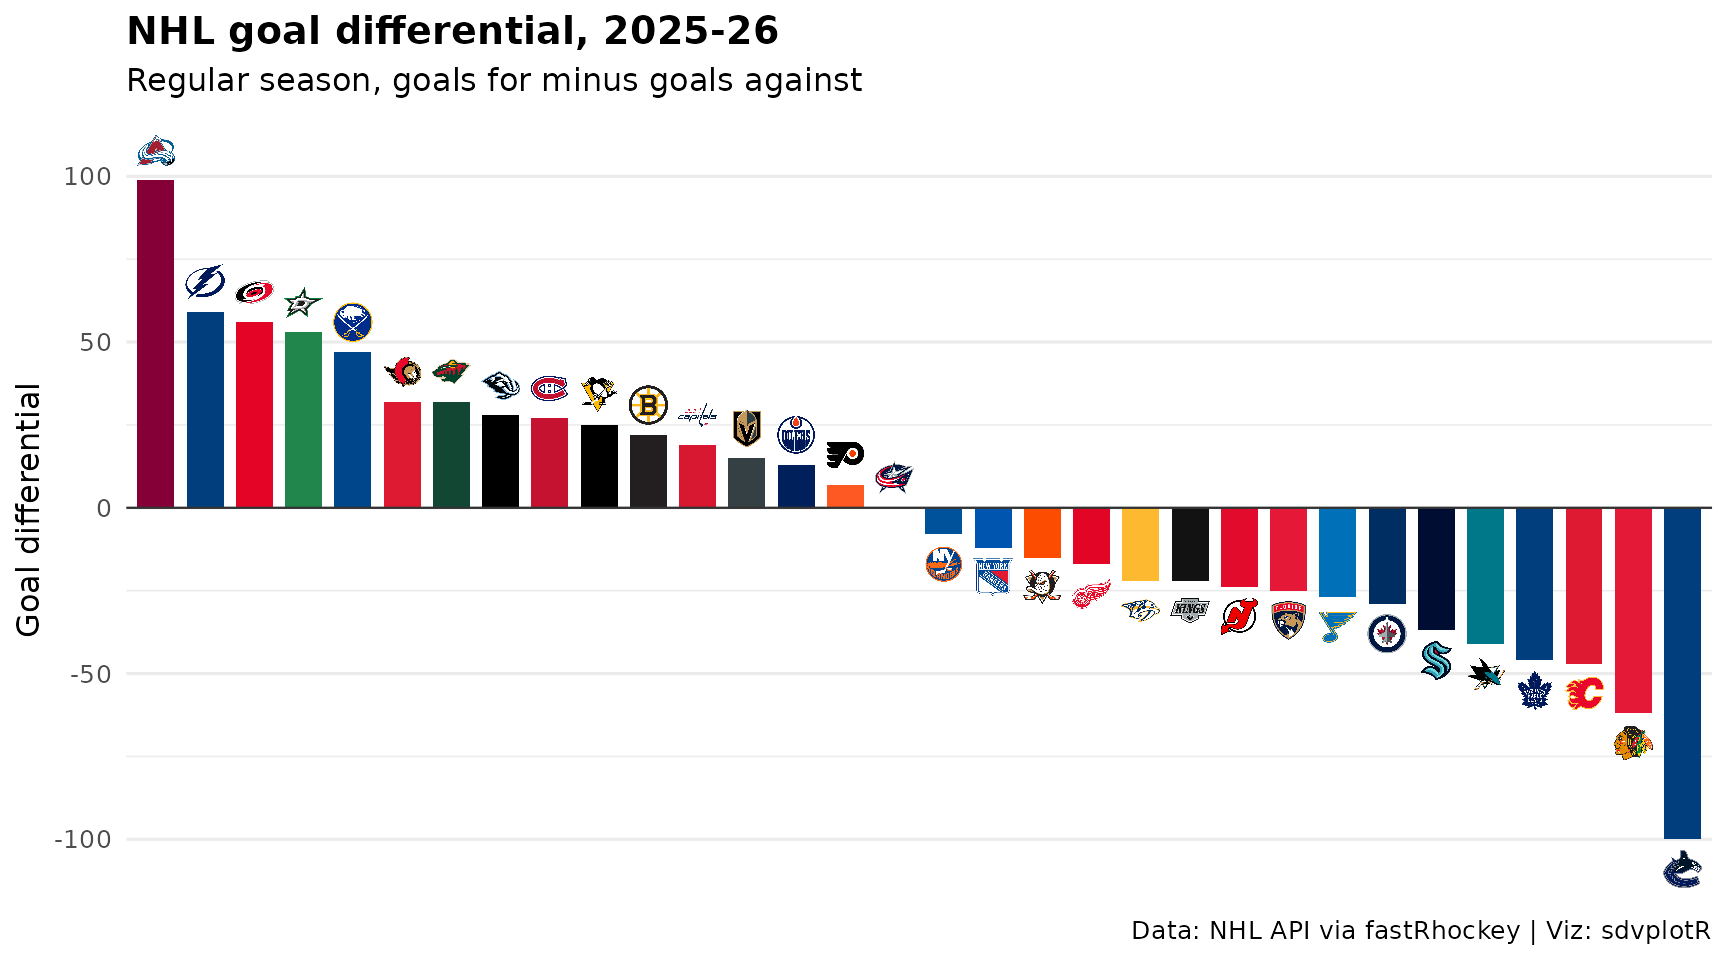 NHL
NHL
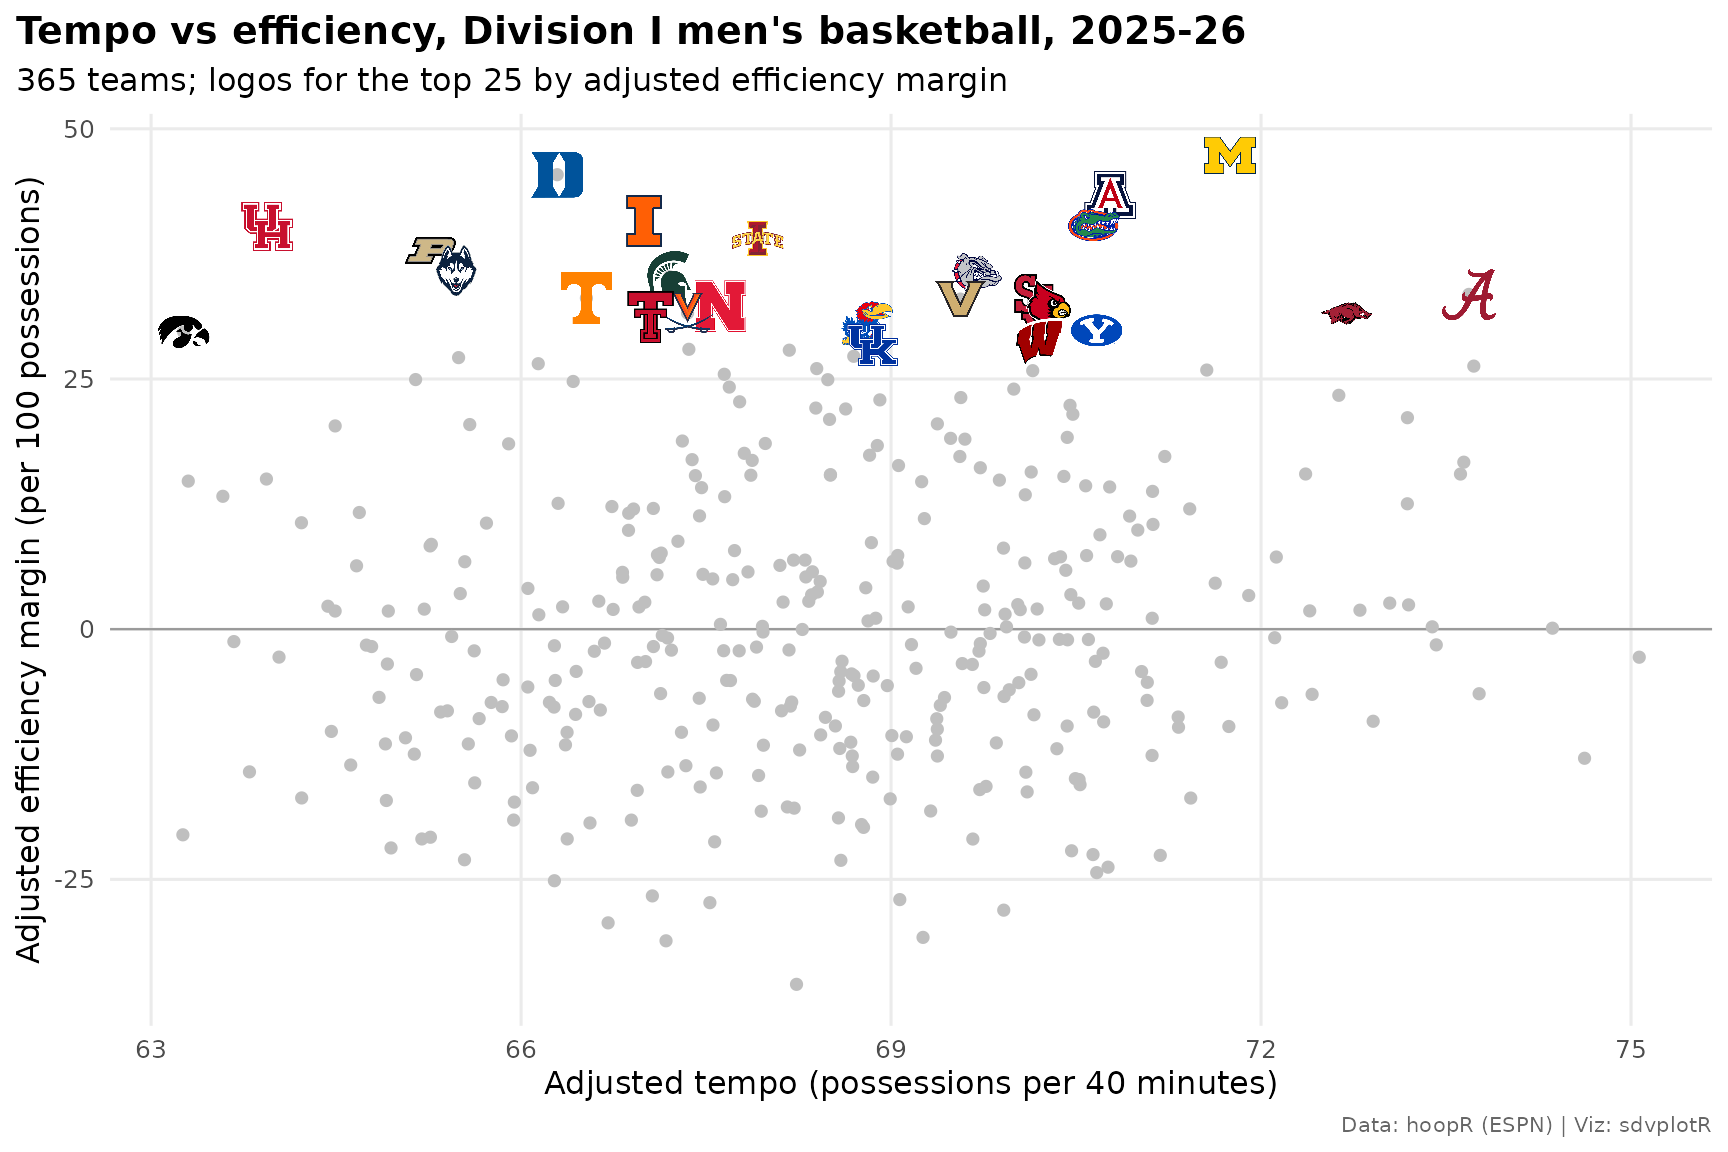 Men's College Basketball
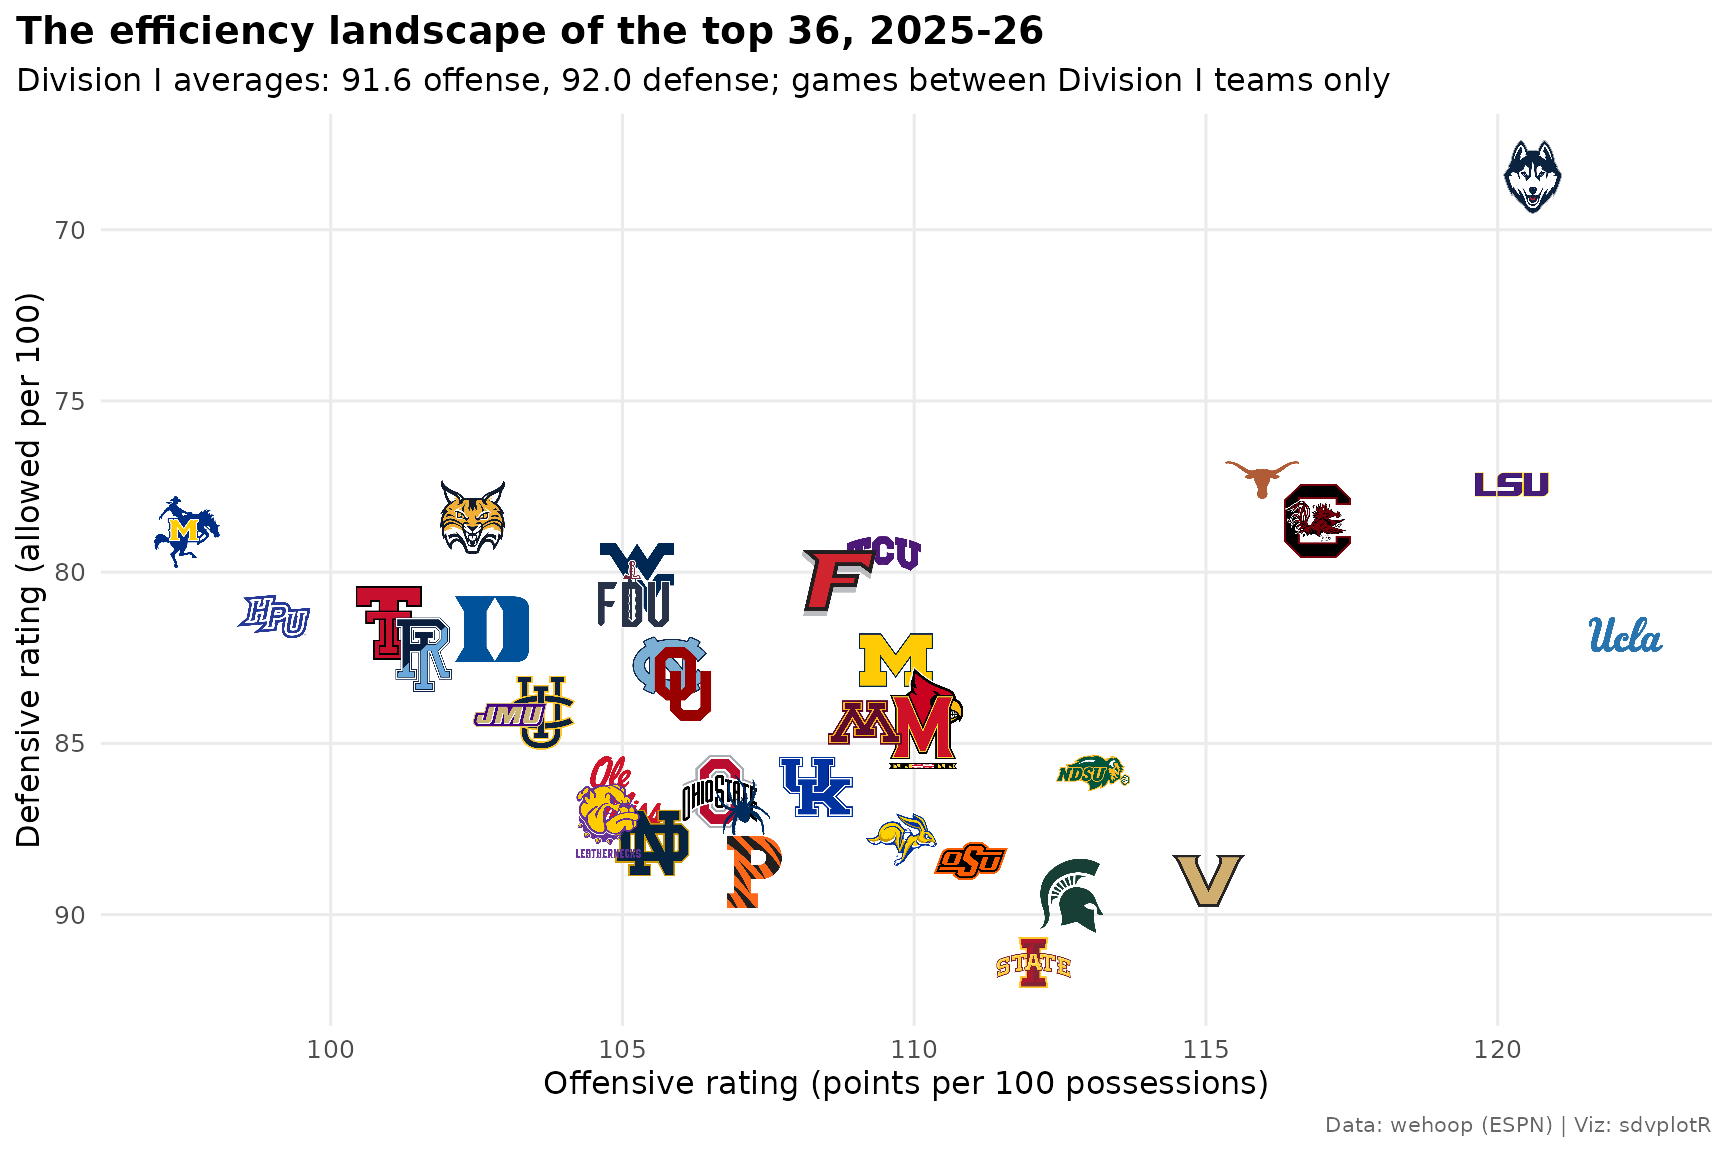 Women's College Basketball
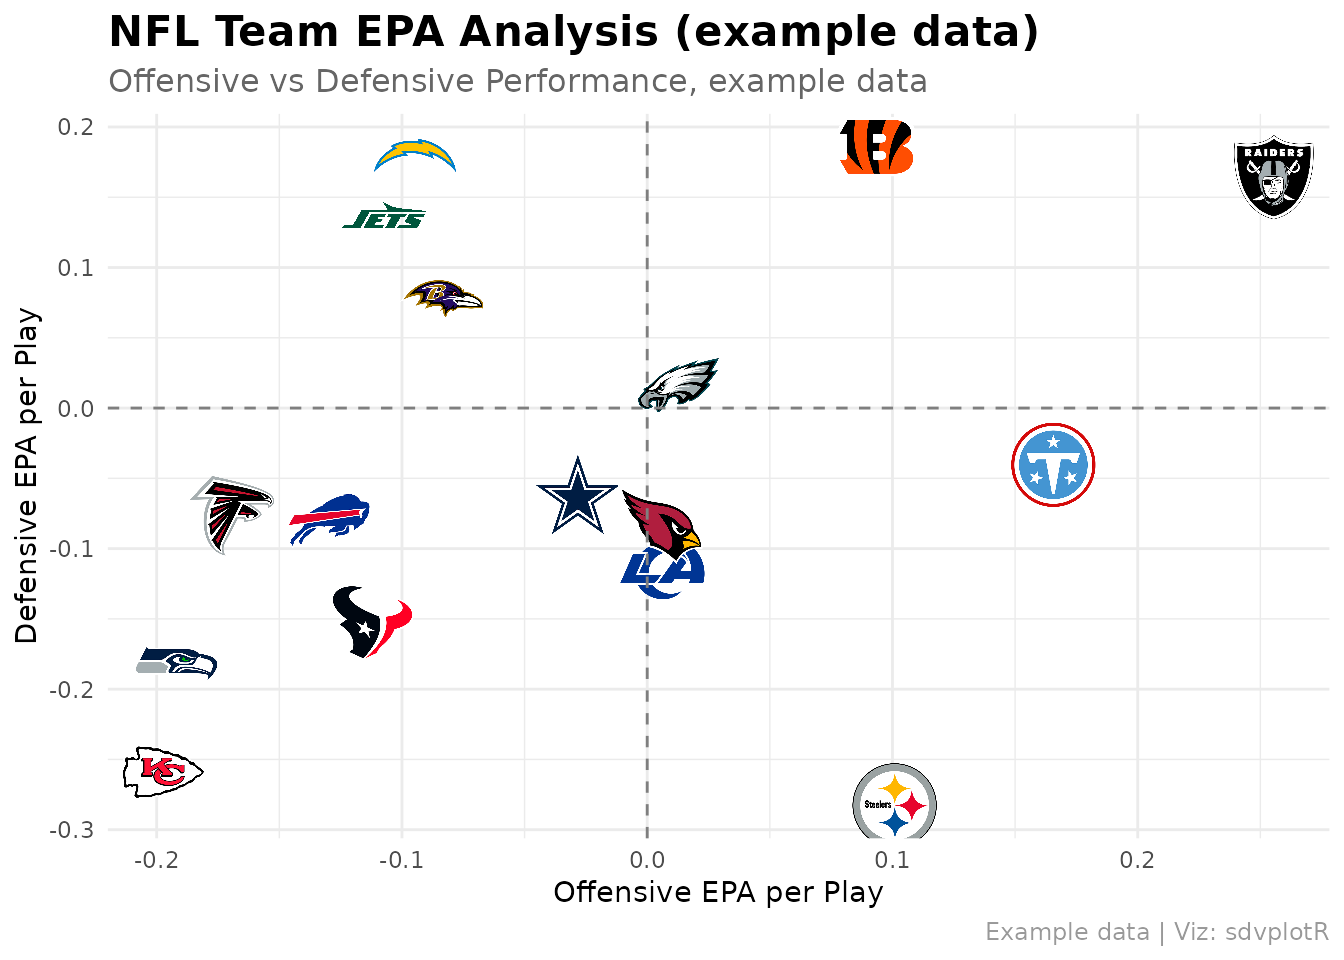 Social Posting
 Leaderboard Dashboards
 reactable Integration
 End-to-End Workflows
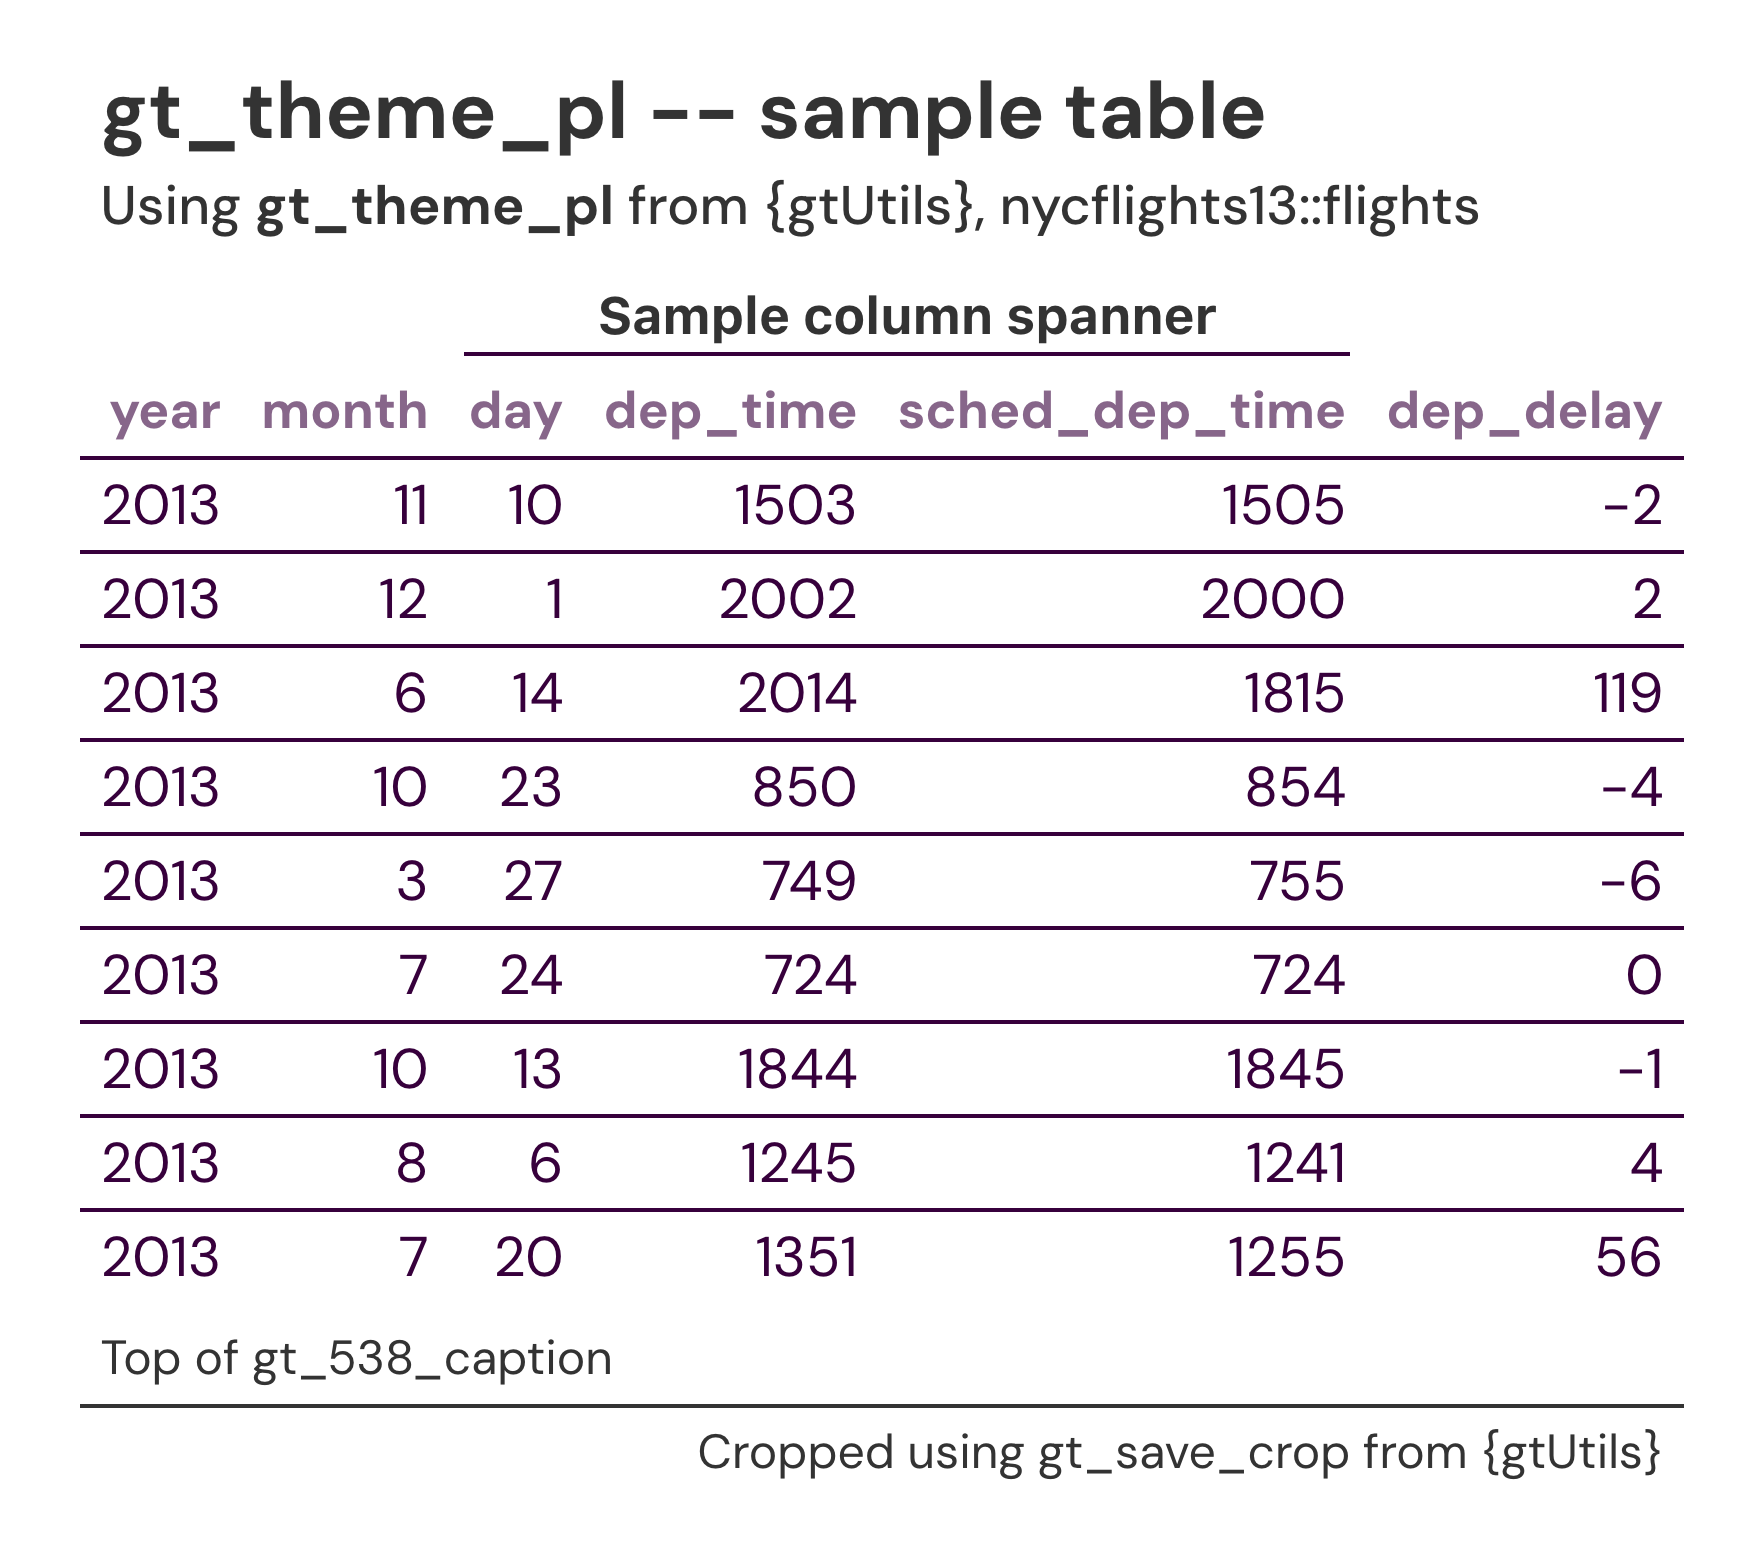
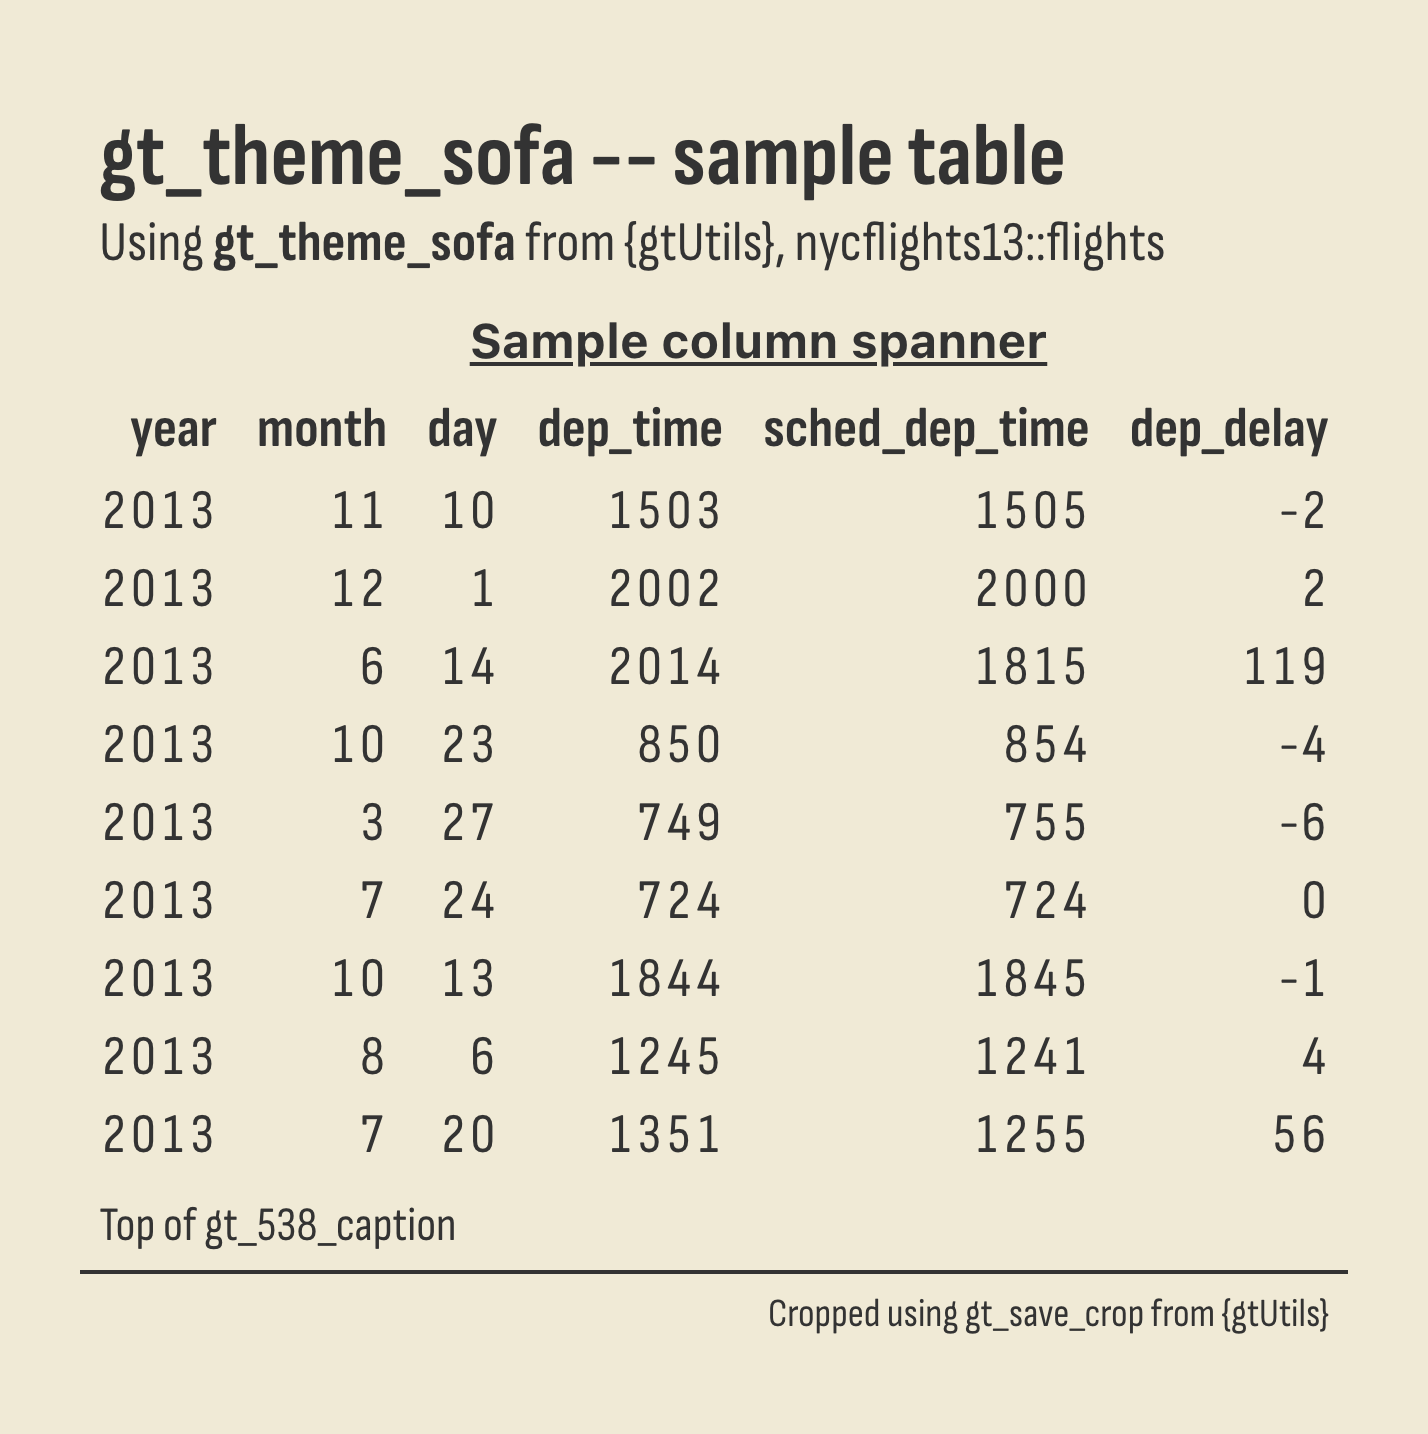
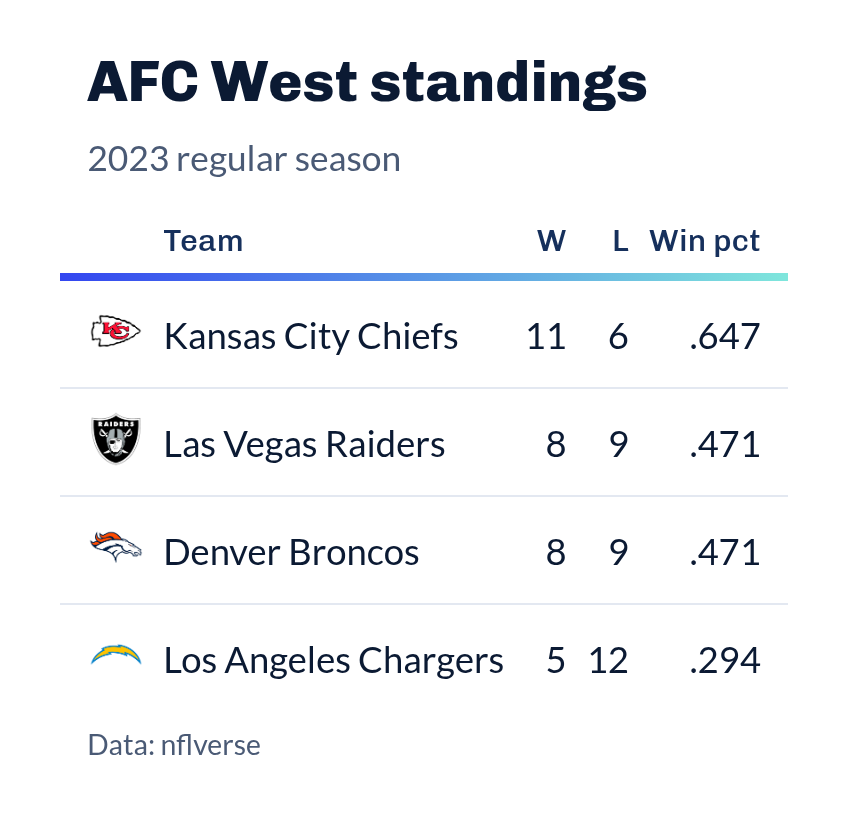 SportsDataverse Table Themes
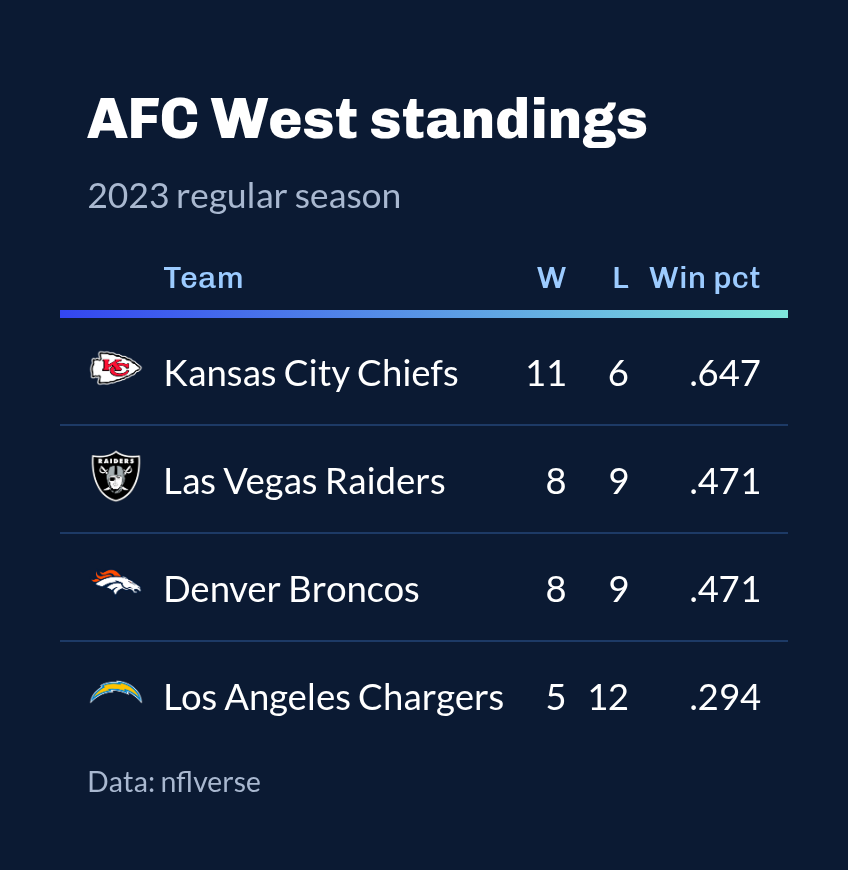 Team Tables with the gt Toolkit
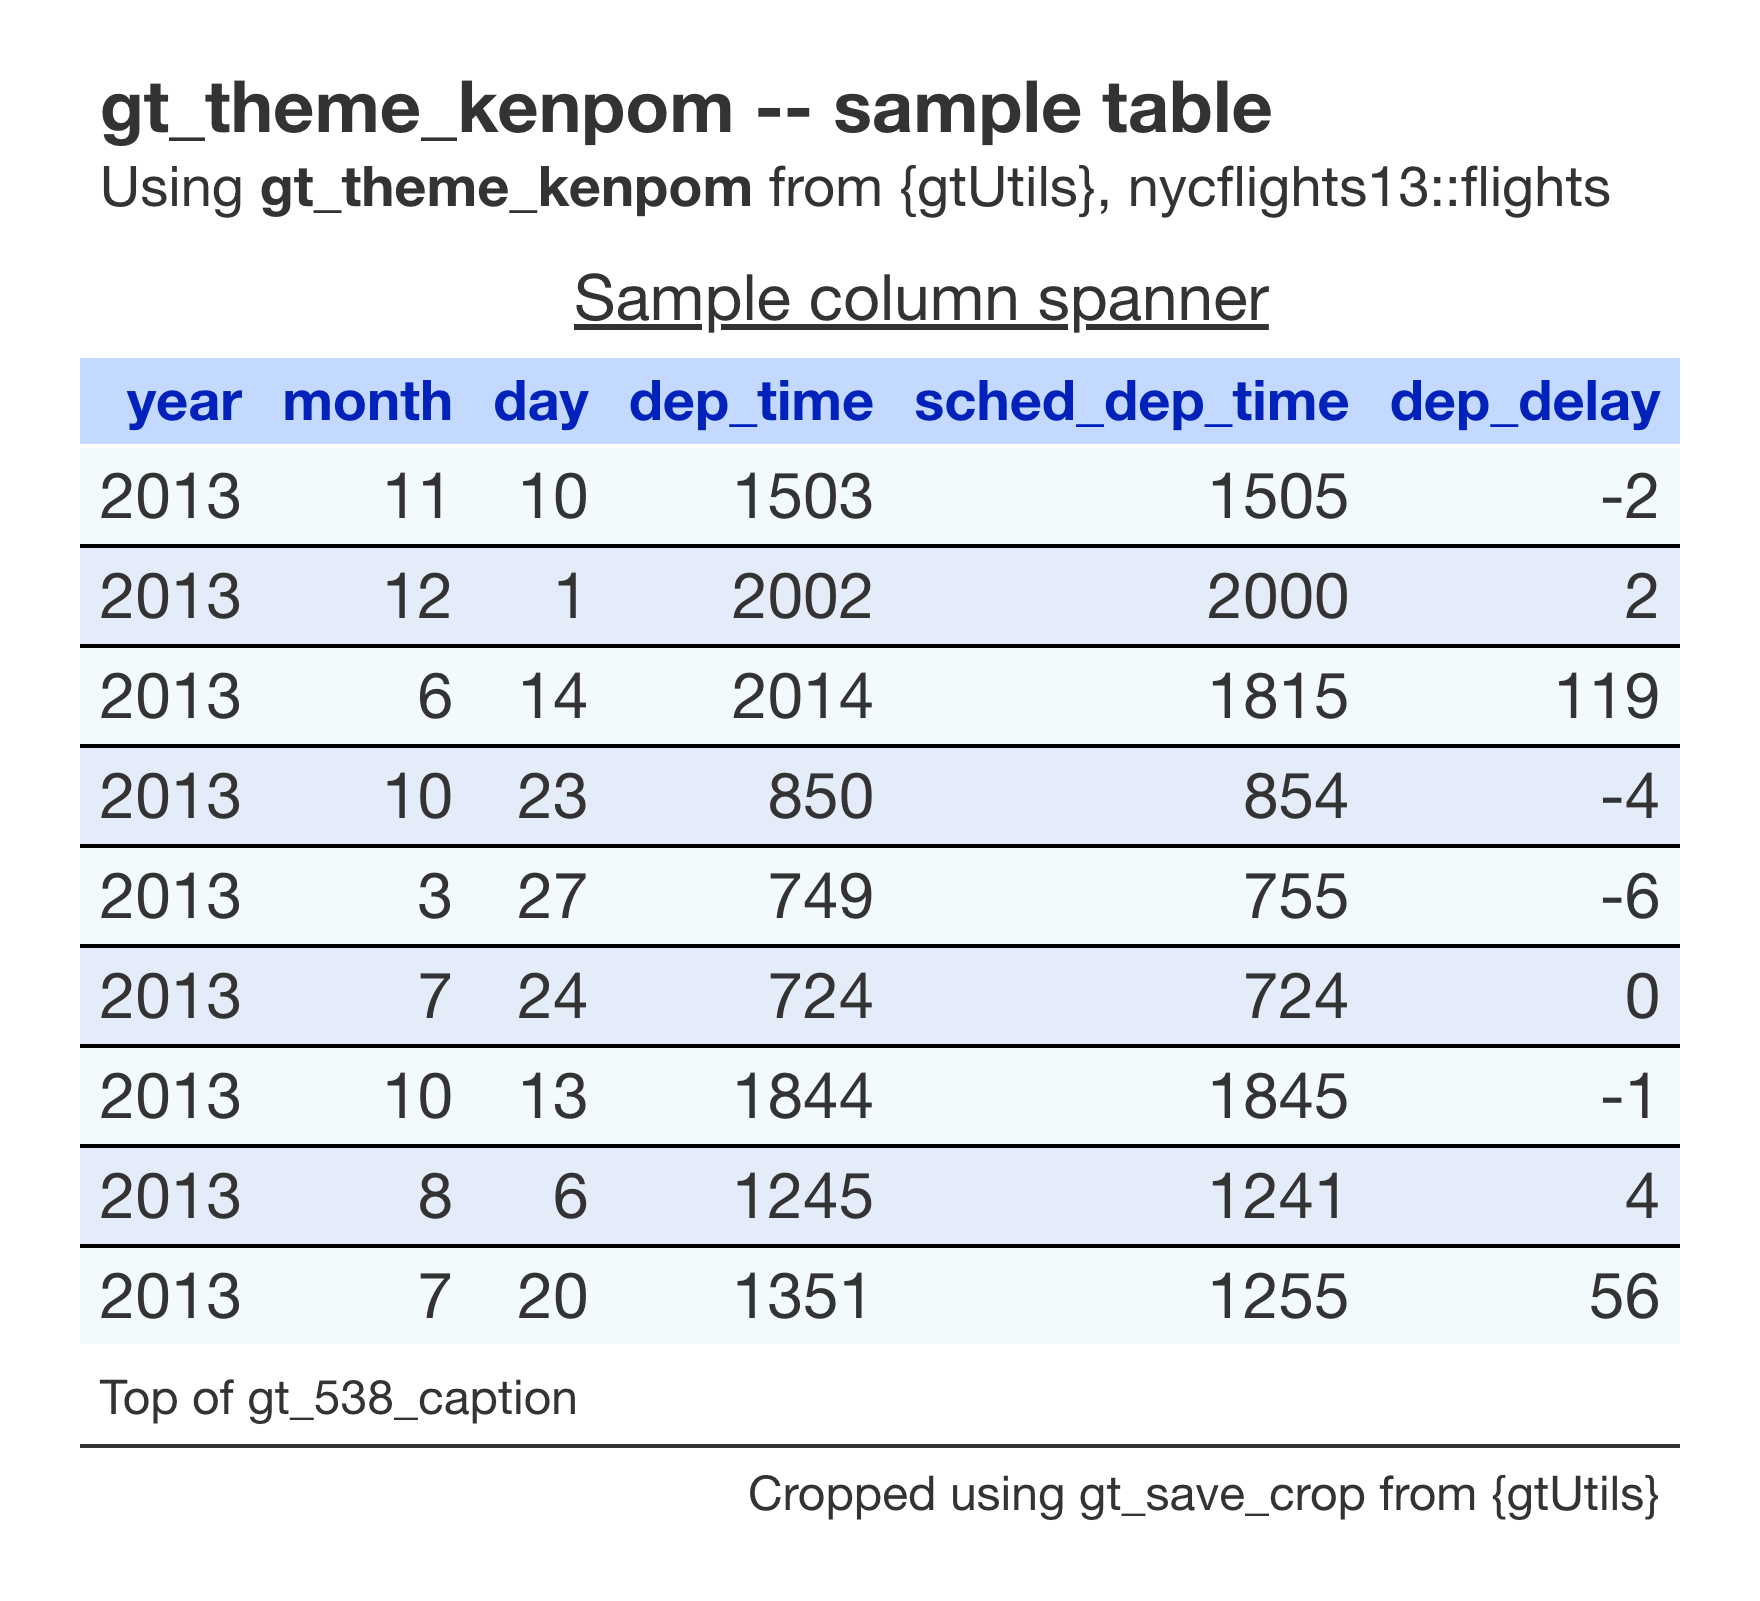
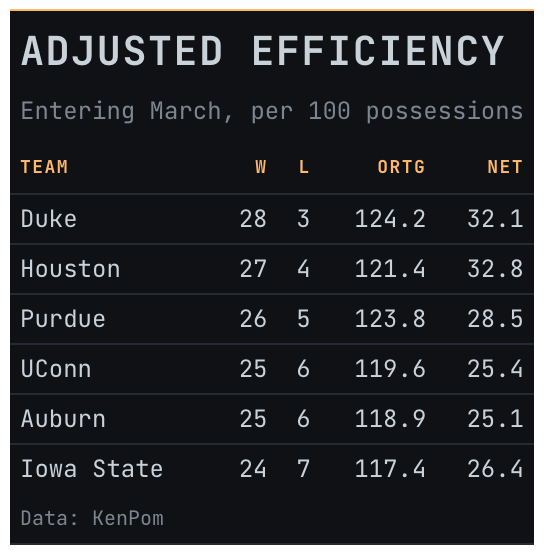 Styling Headers, Legends and Captions
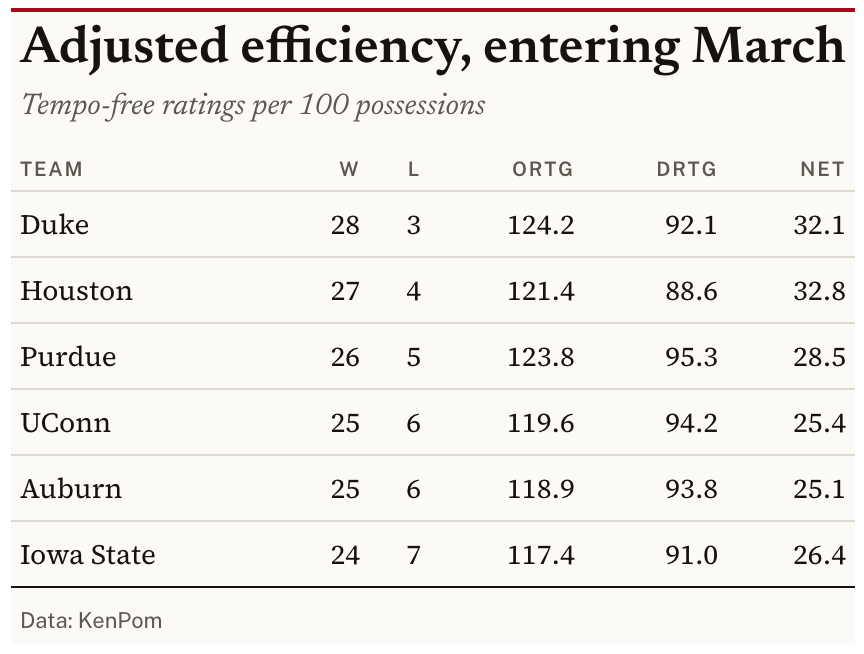 Saving and Posting Tables
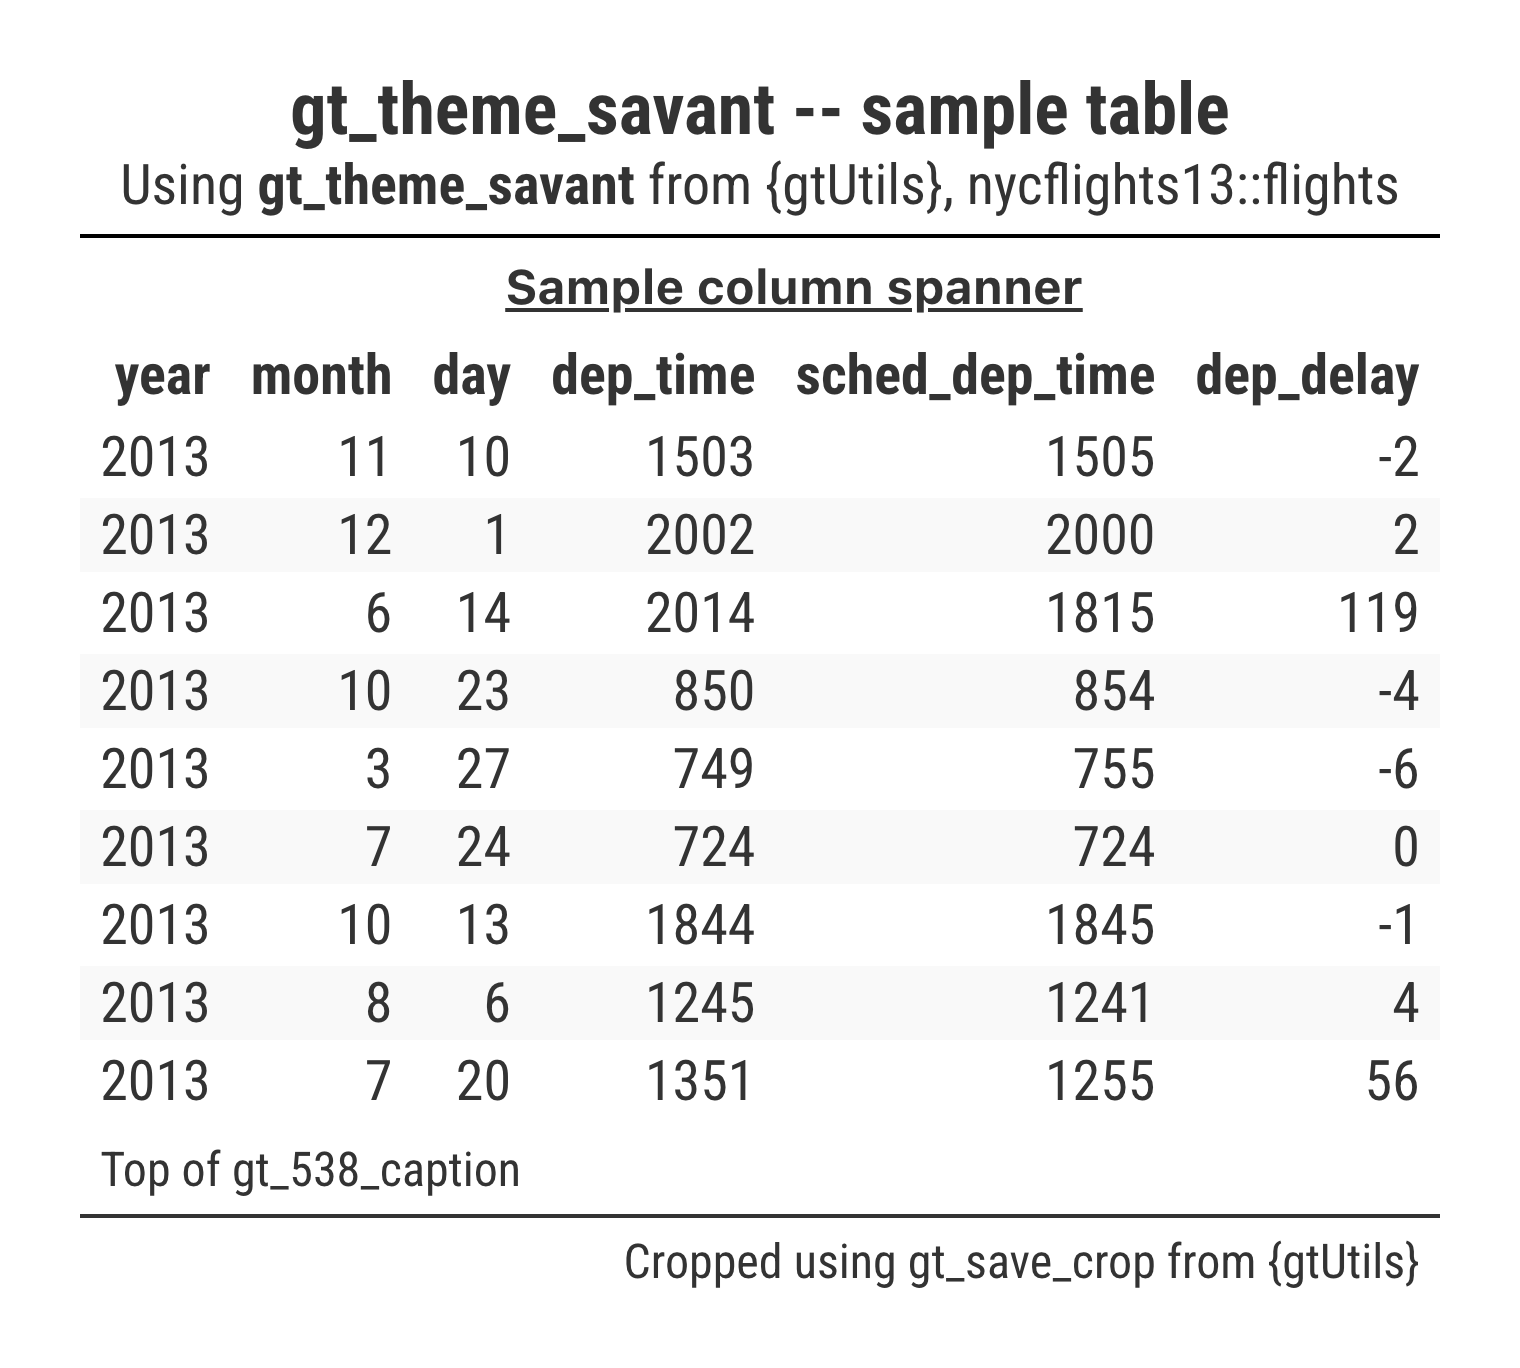 Border Bars
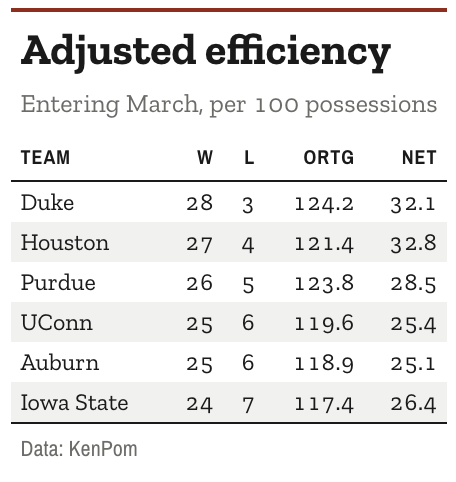 Percentile Bars and Cut Lines
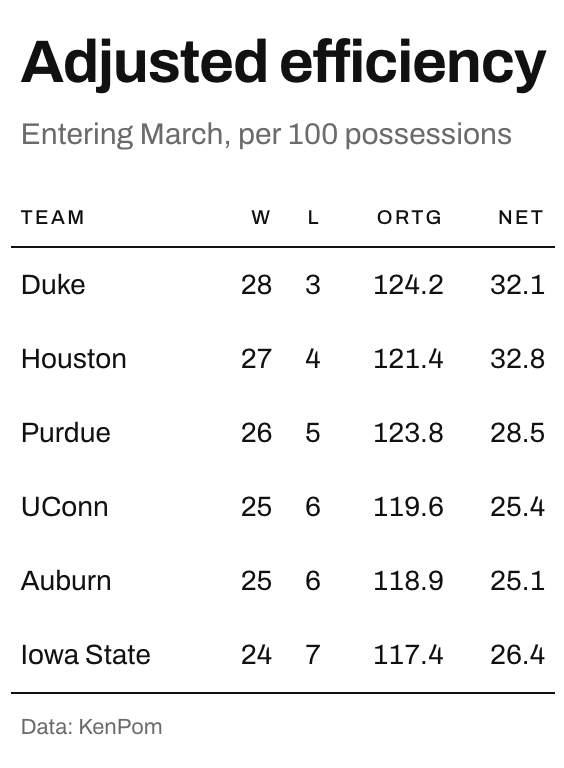 Faceted Tables
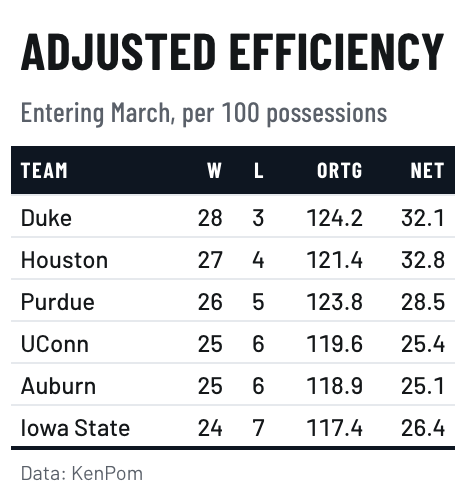 Schedule Matrix
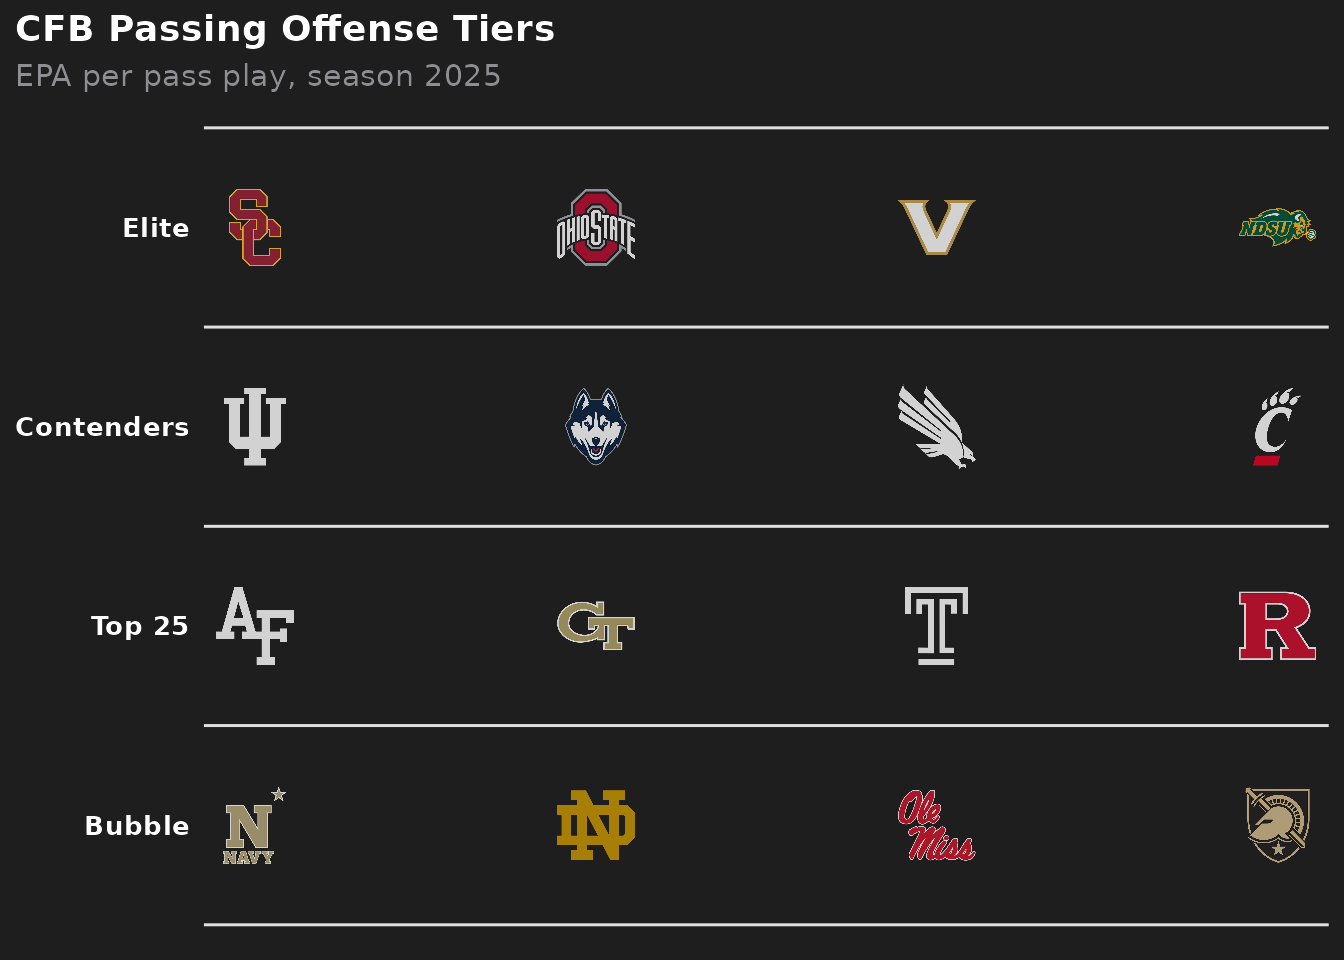
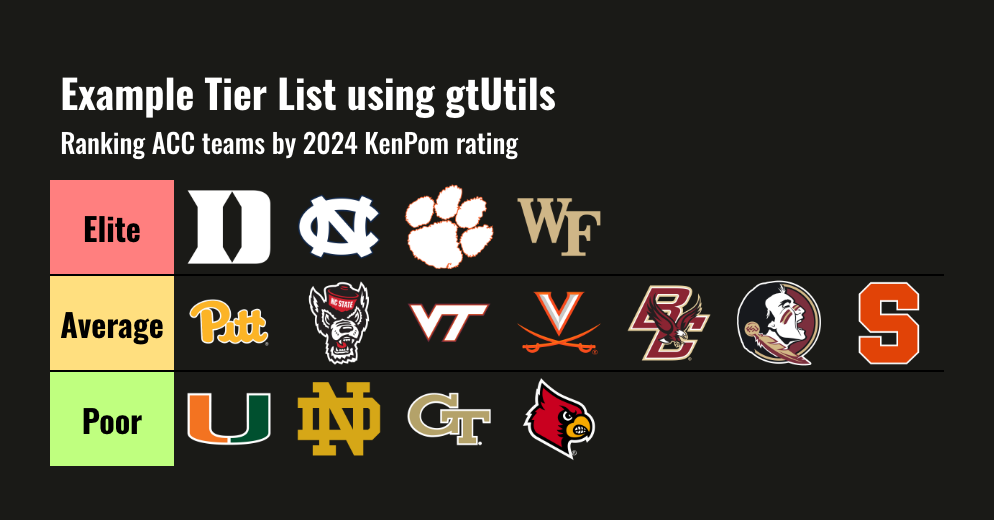 Tier Lists
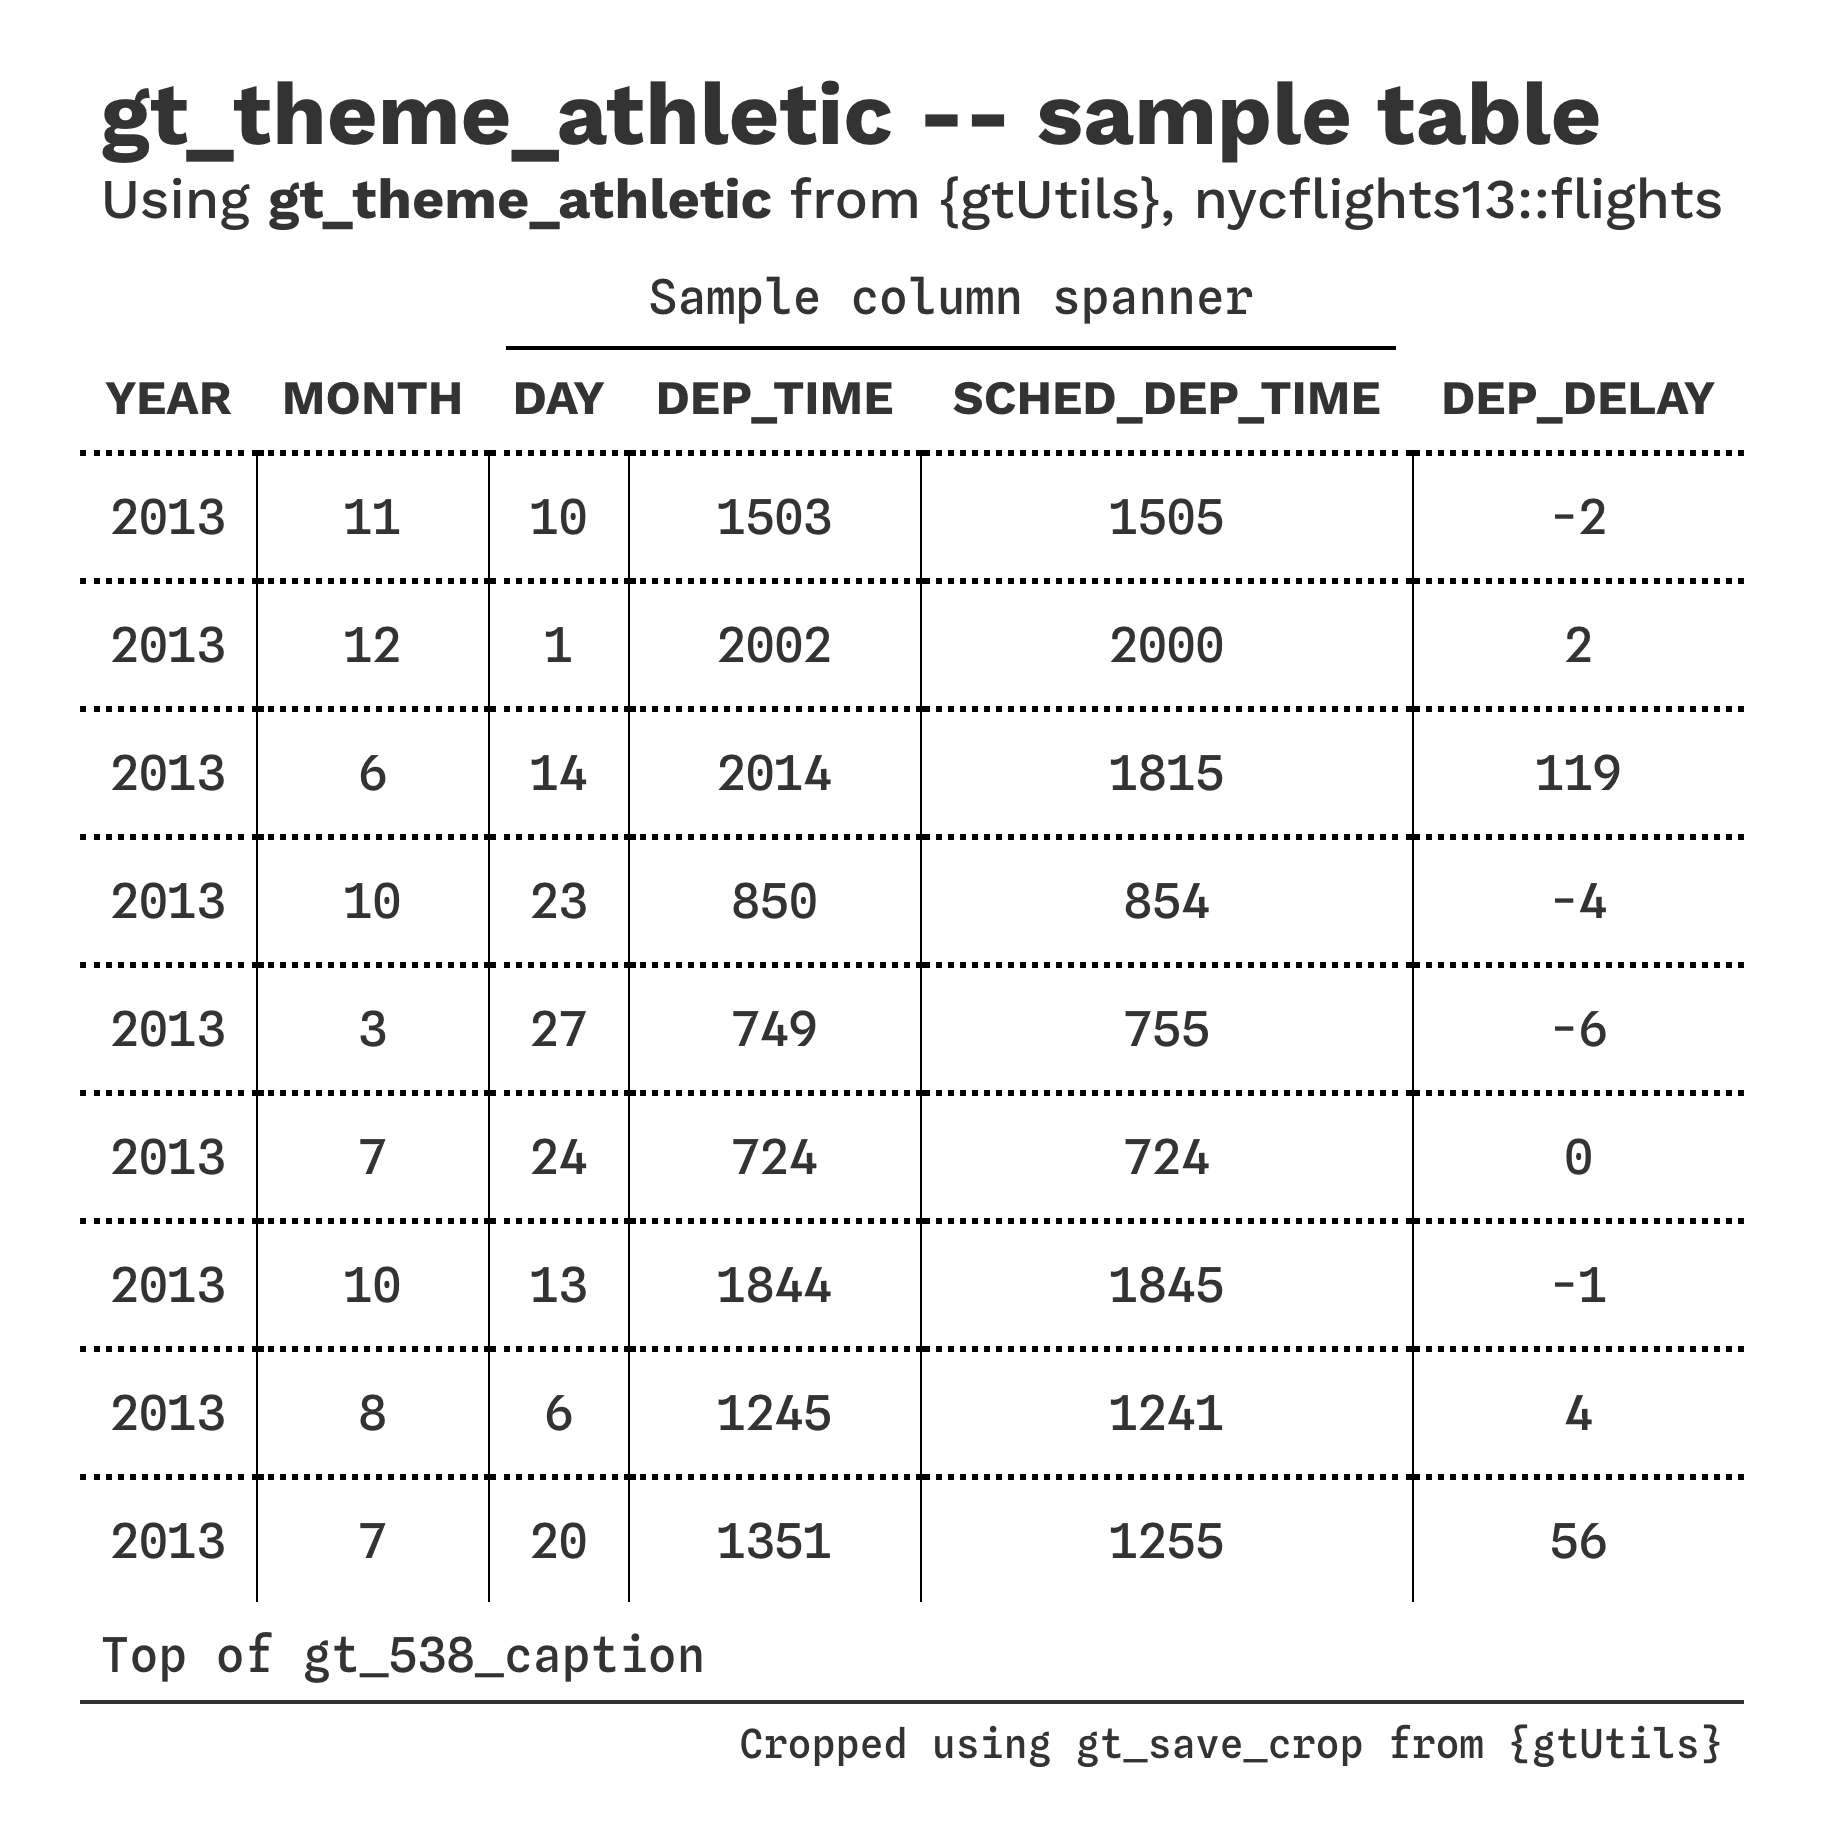 Rolling-Window Wins
 Neighbour Ranks
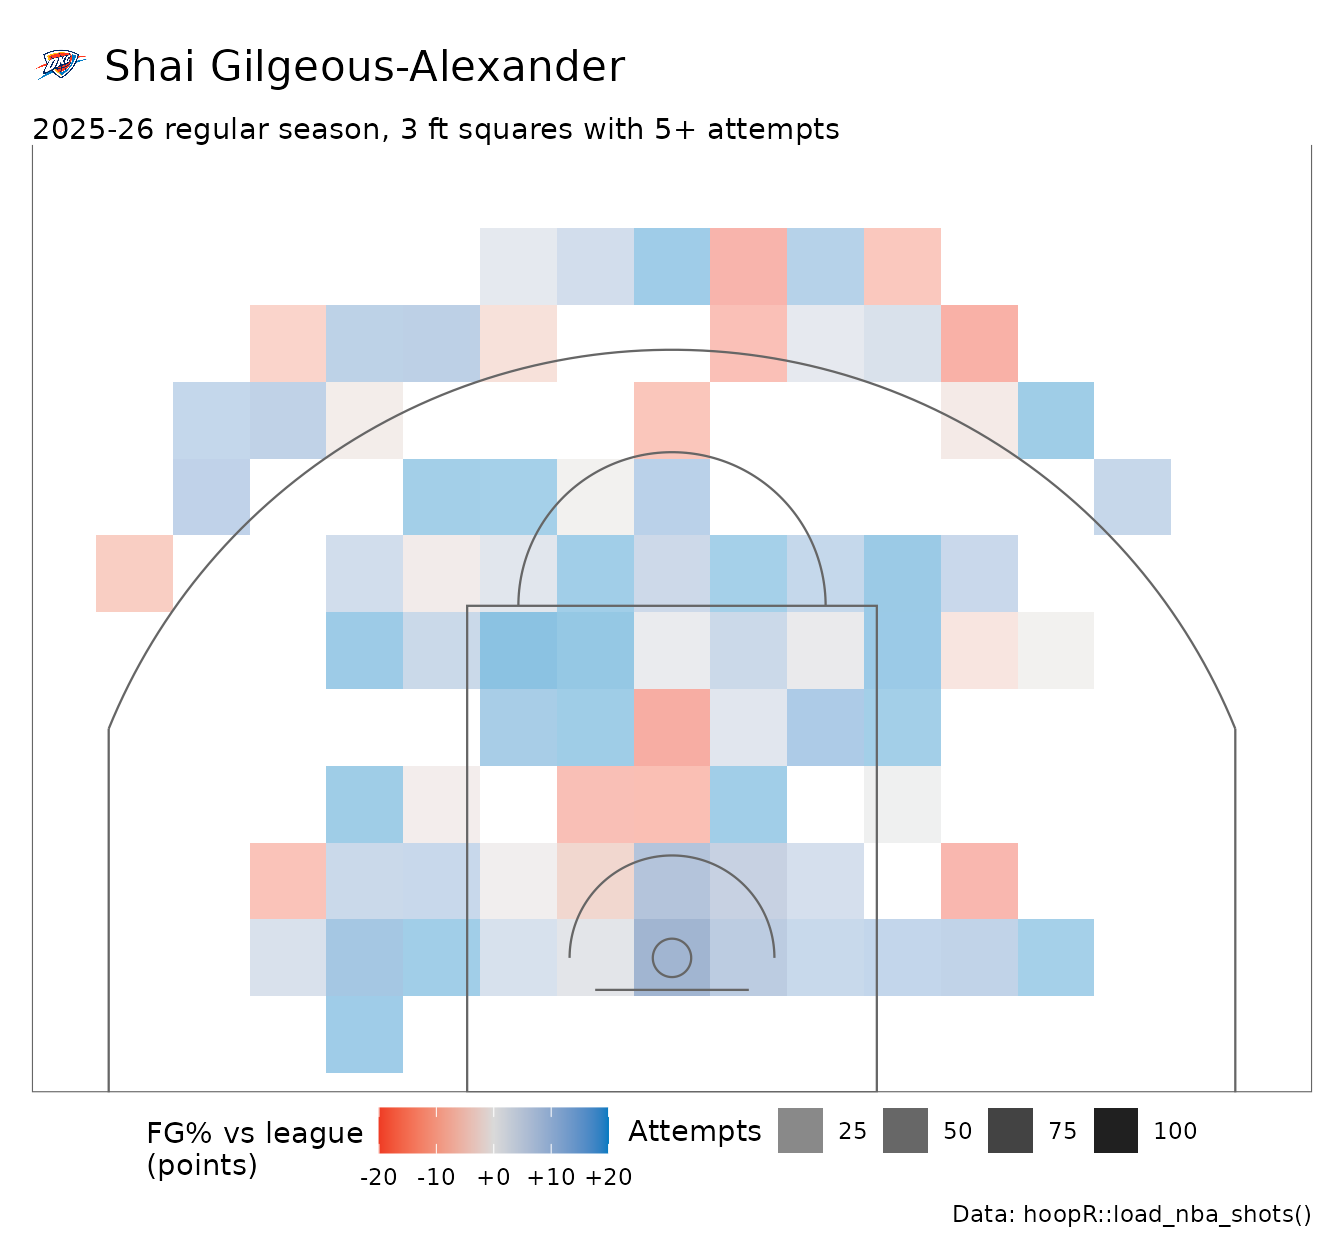 Shot Grid
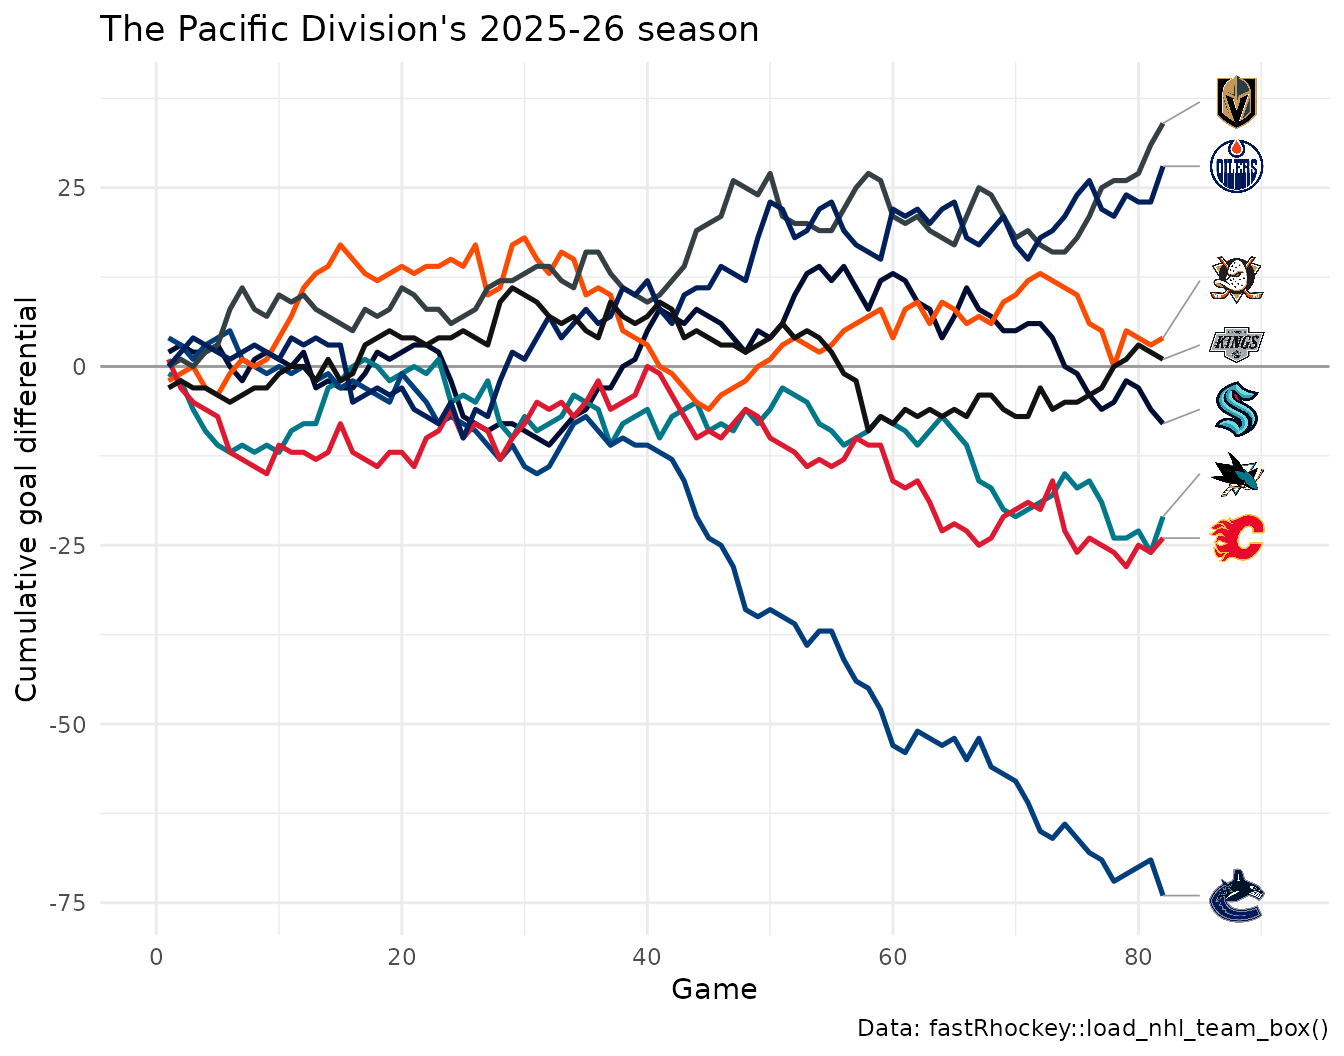
 Rolling Form
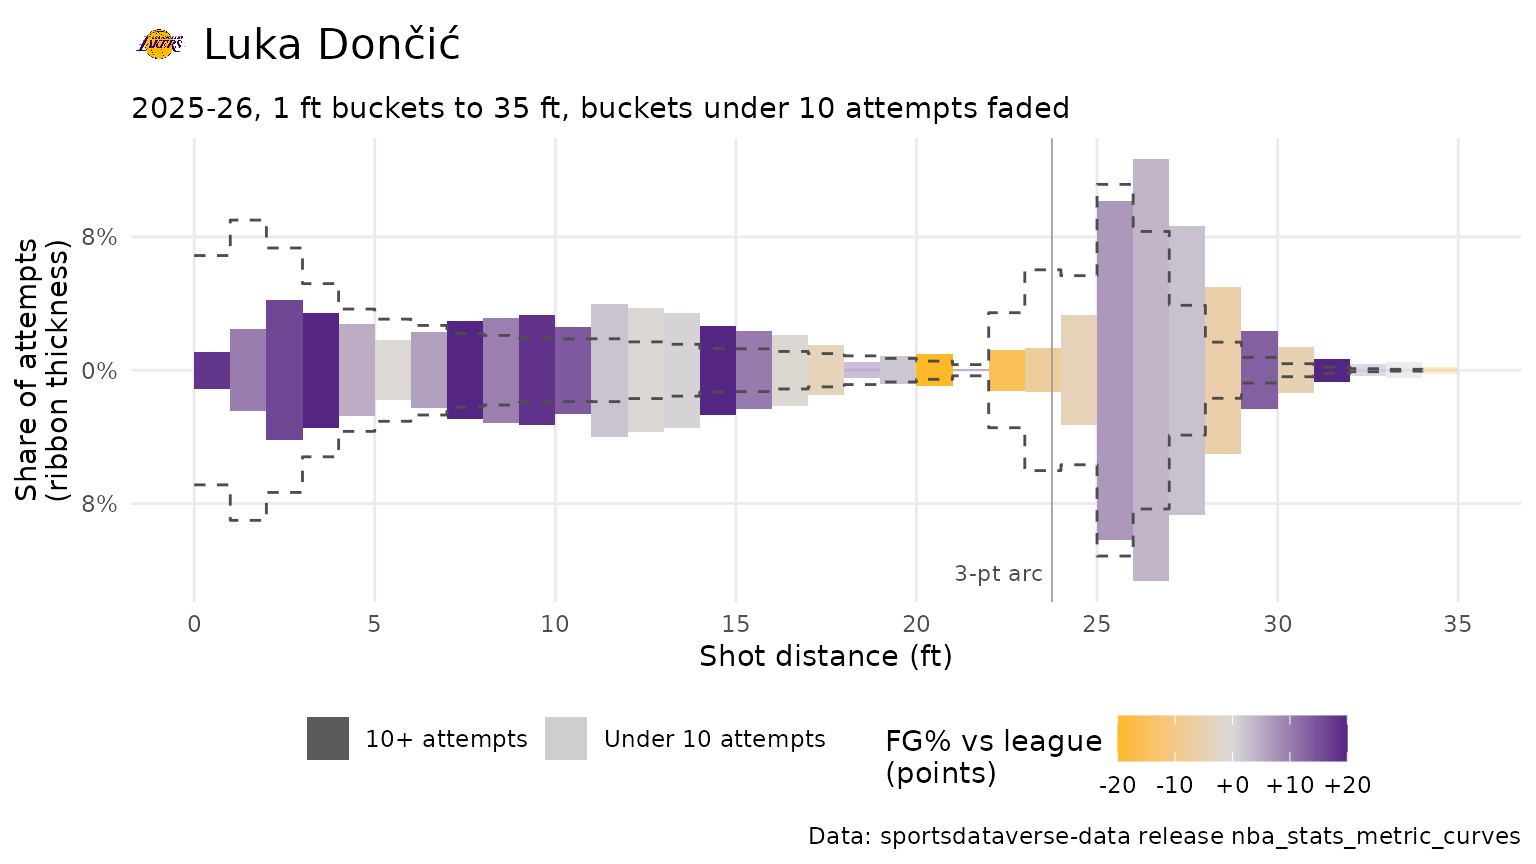 Signature Ribbon
 Logos, Wordmarks and Headshots in ggplot2
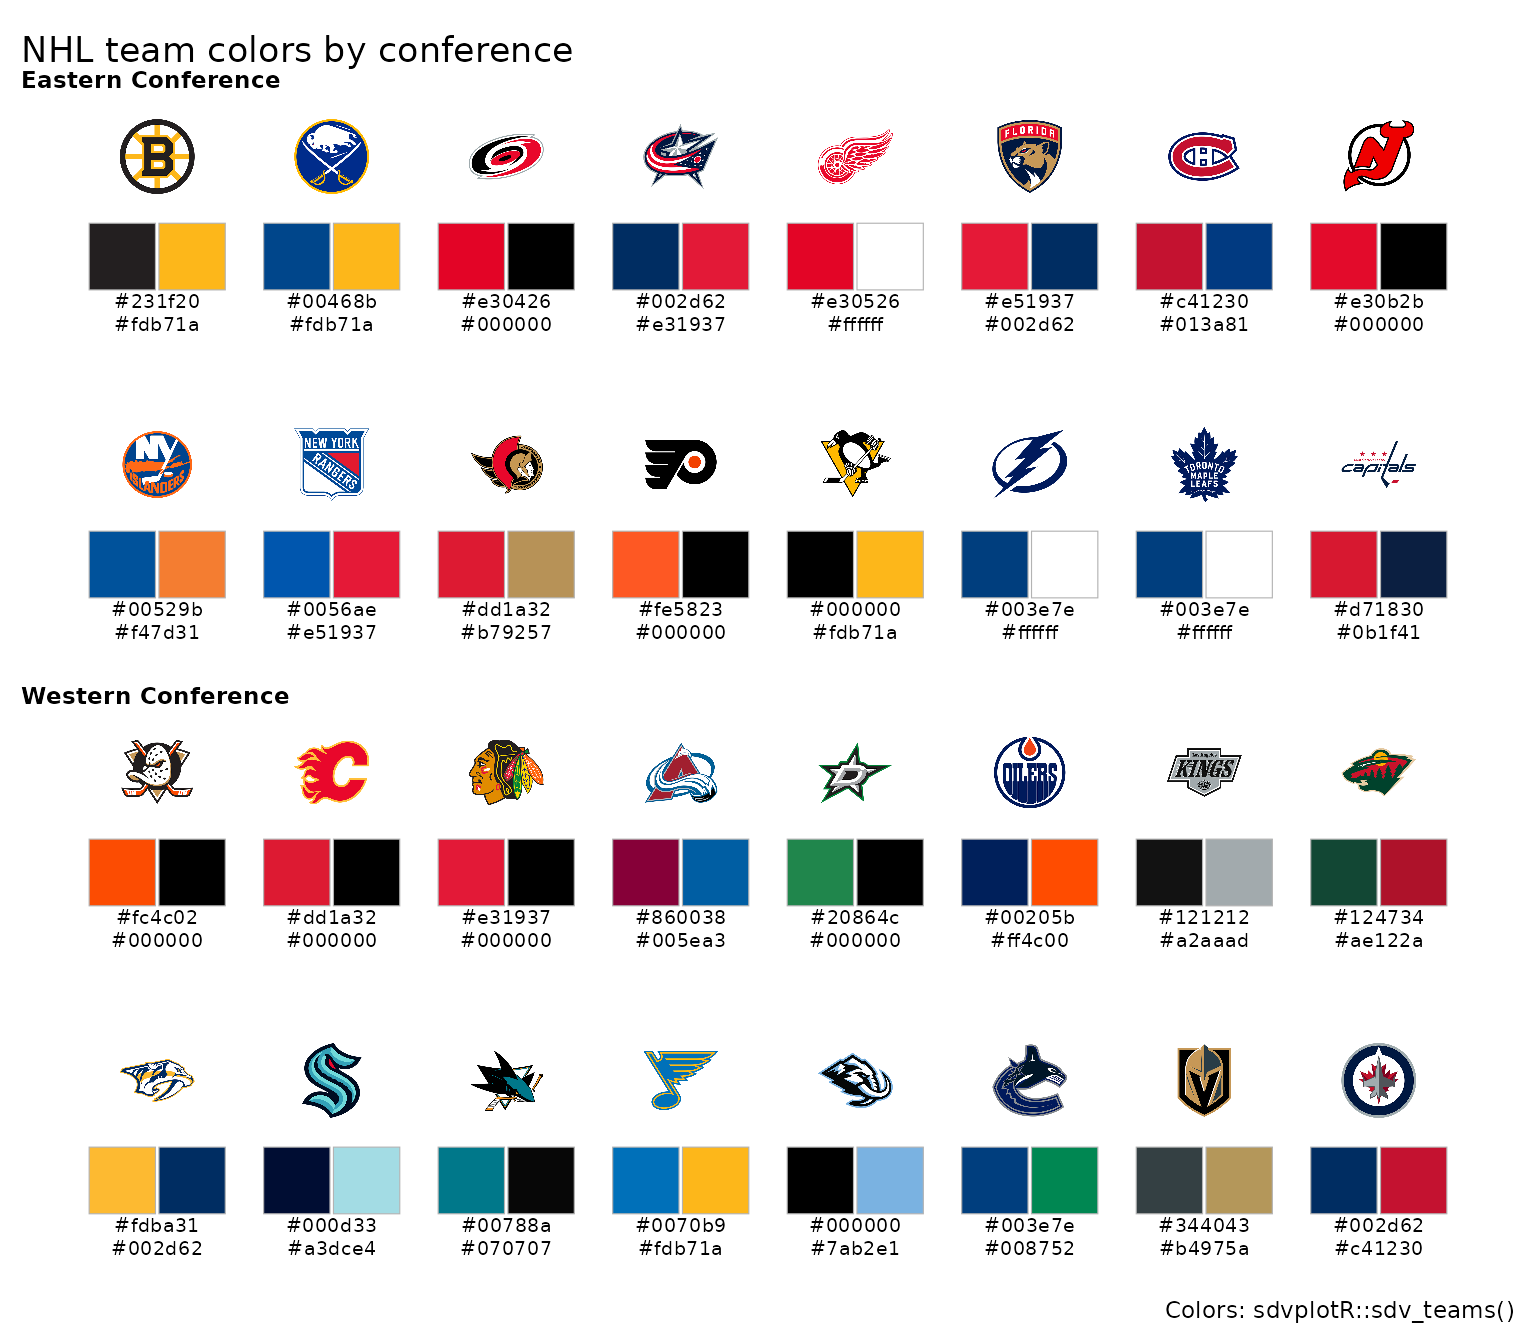 Team Colors and Themes
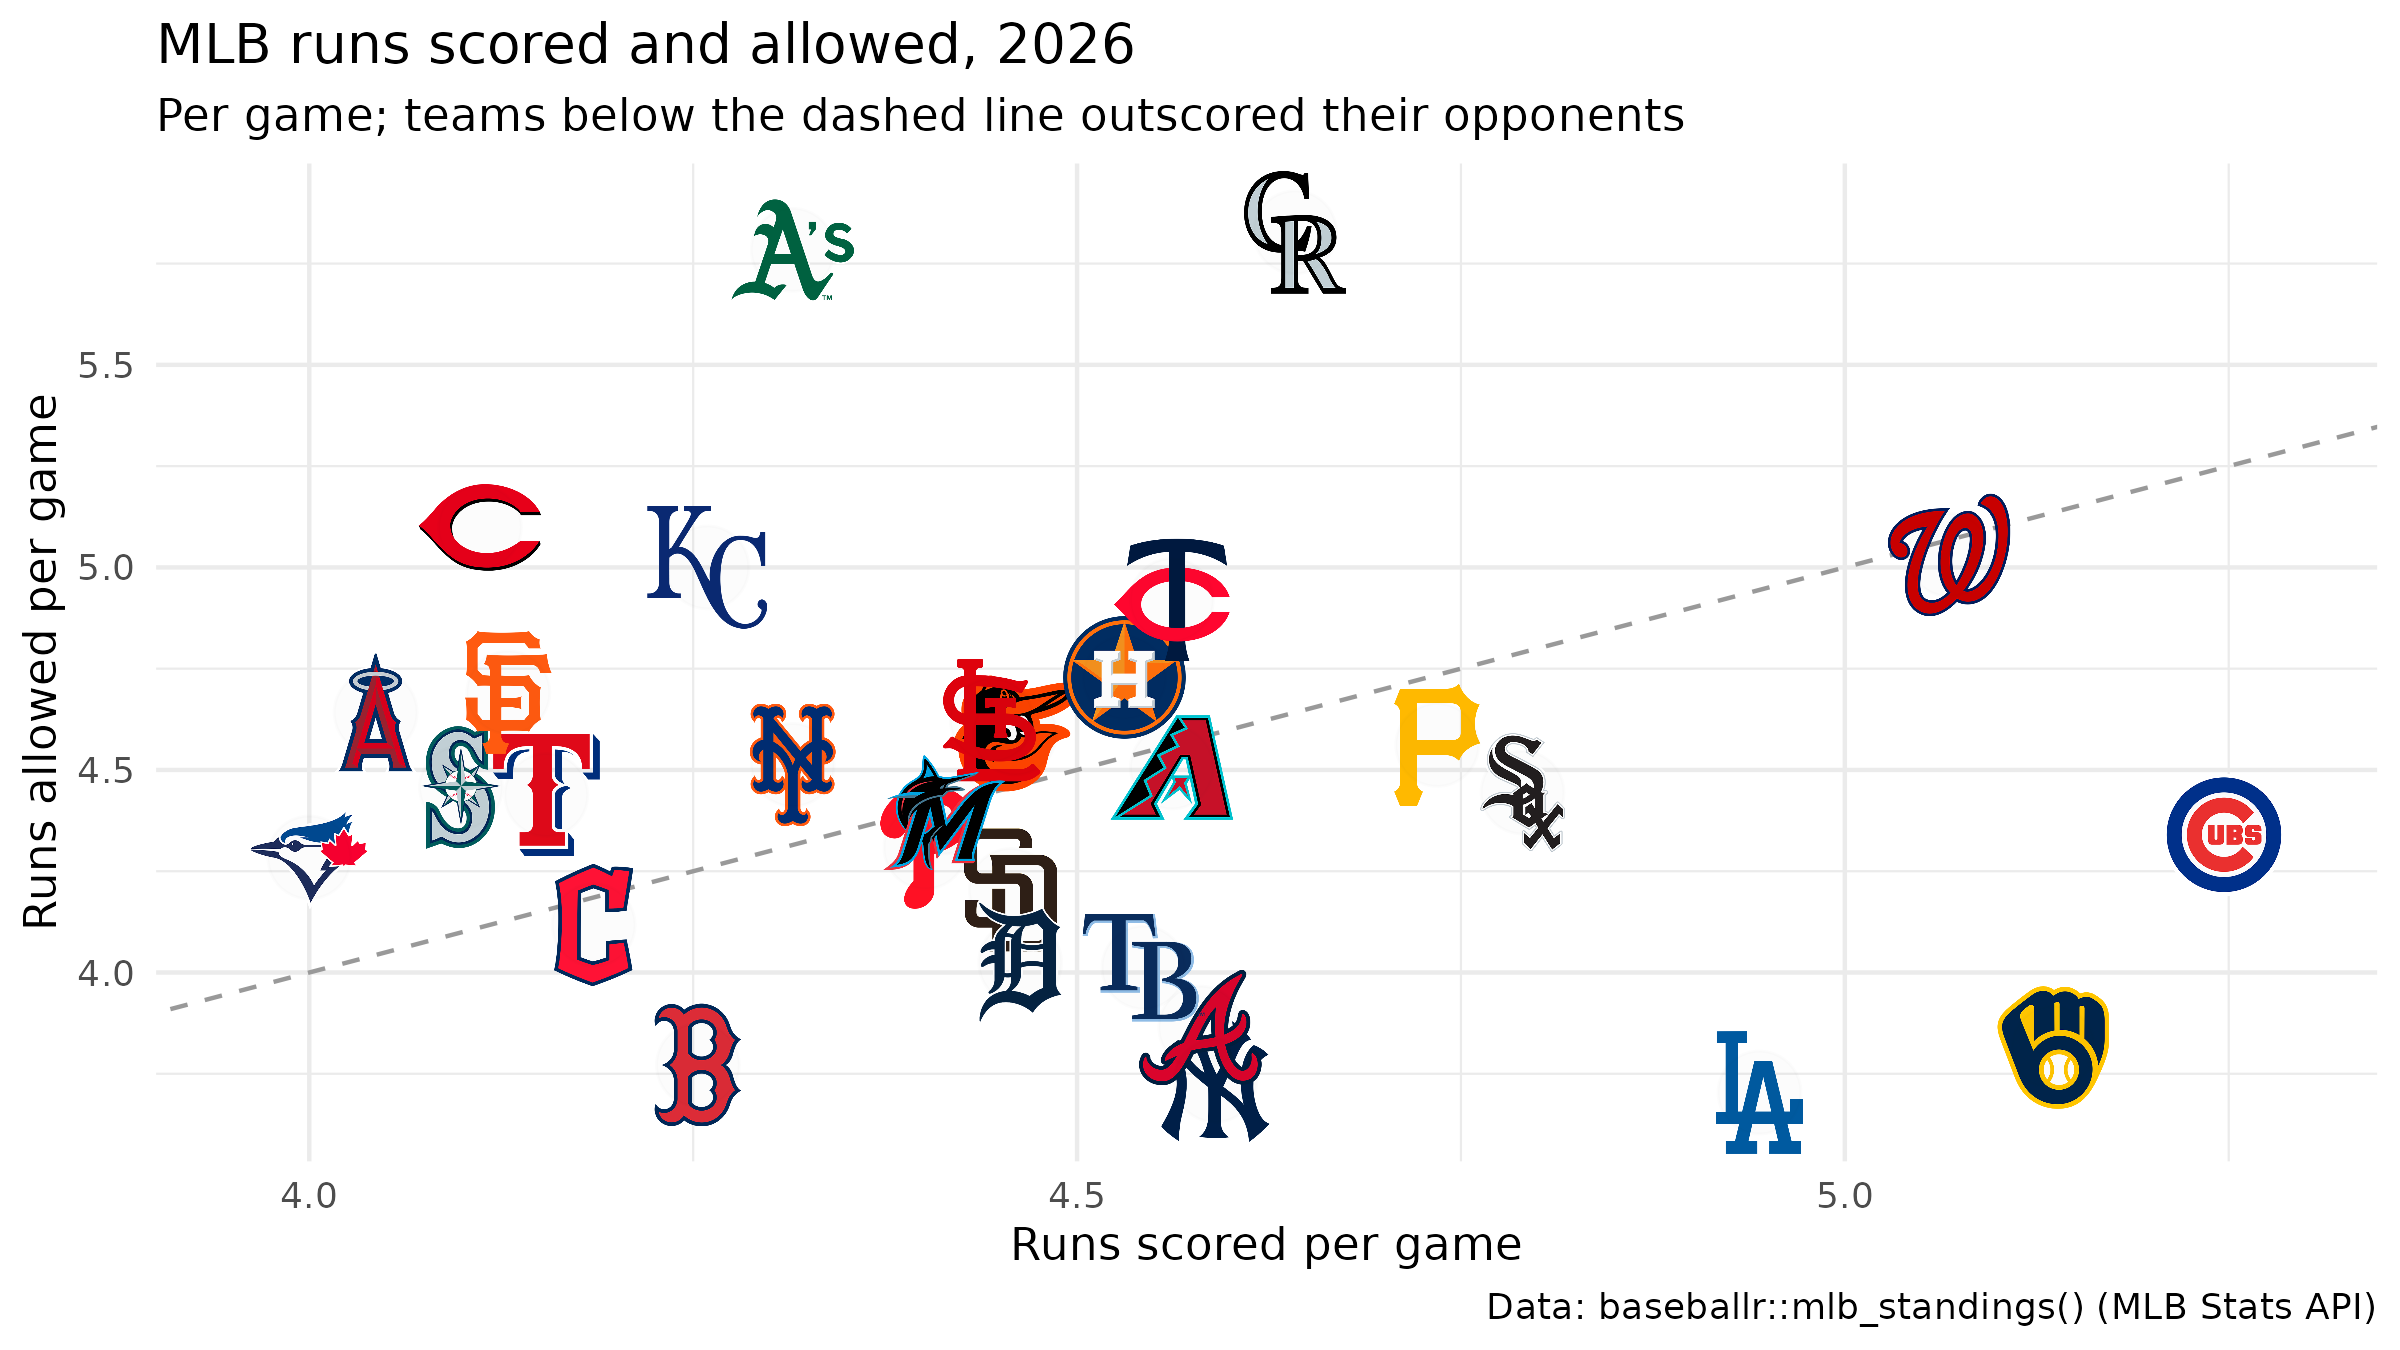 Interactive Charts
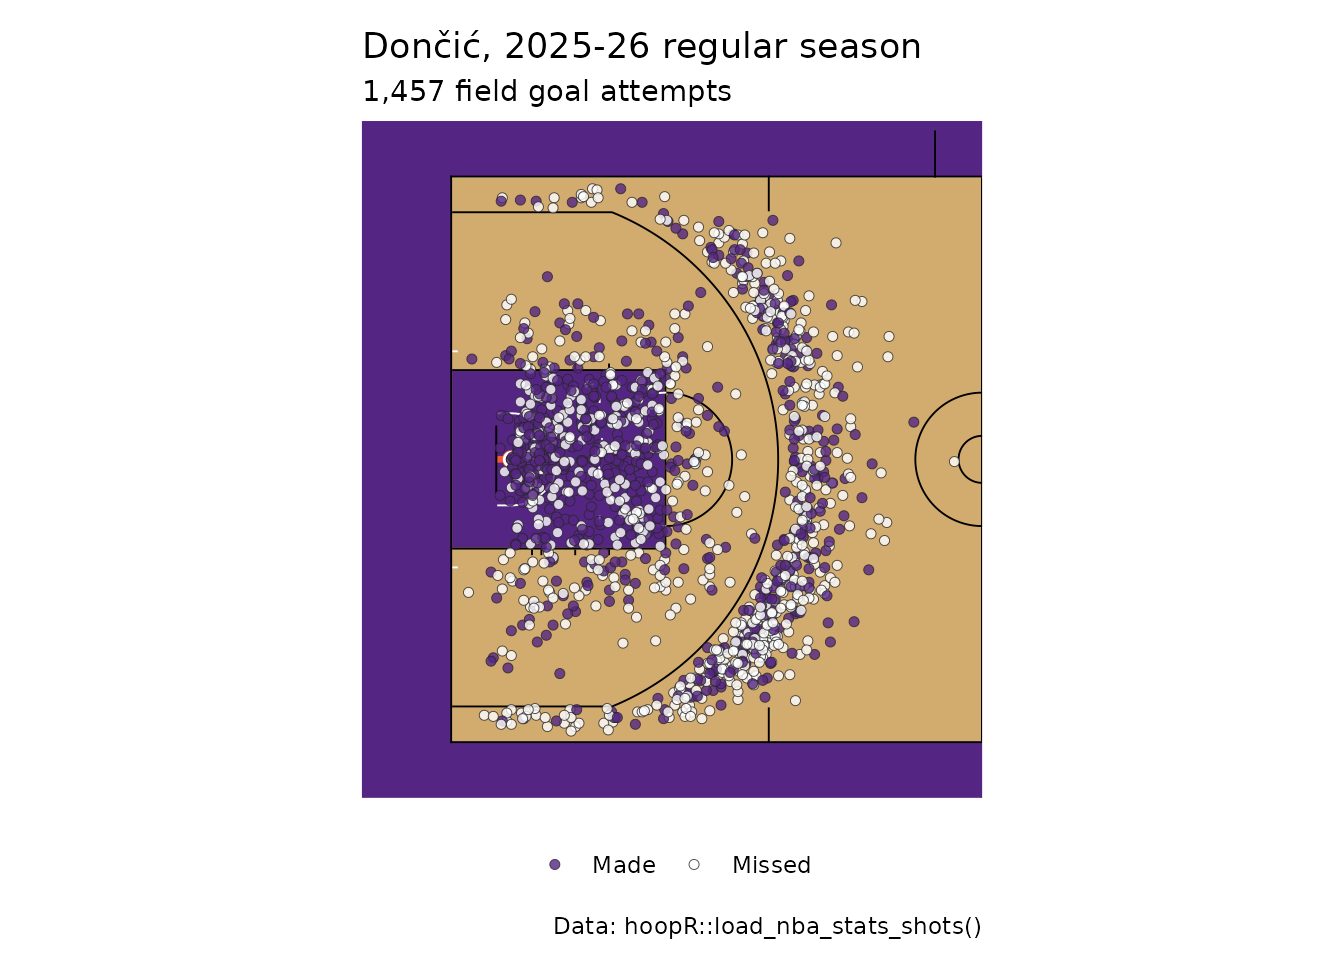 Surfaces and Shot Charts
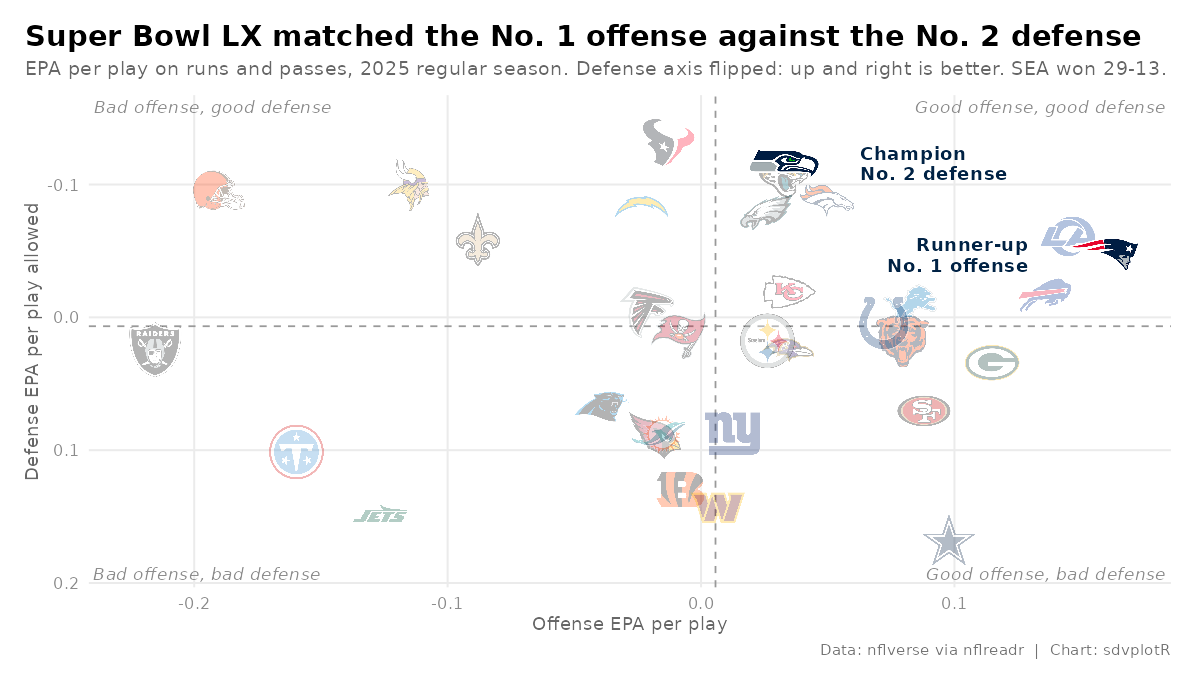 Recipe: NFL EPA Scatter
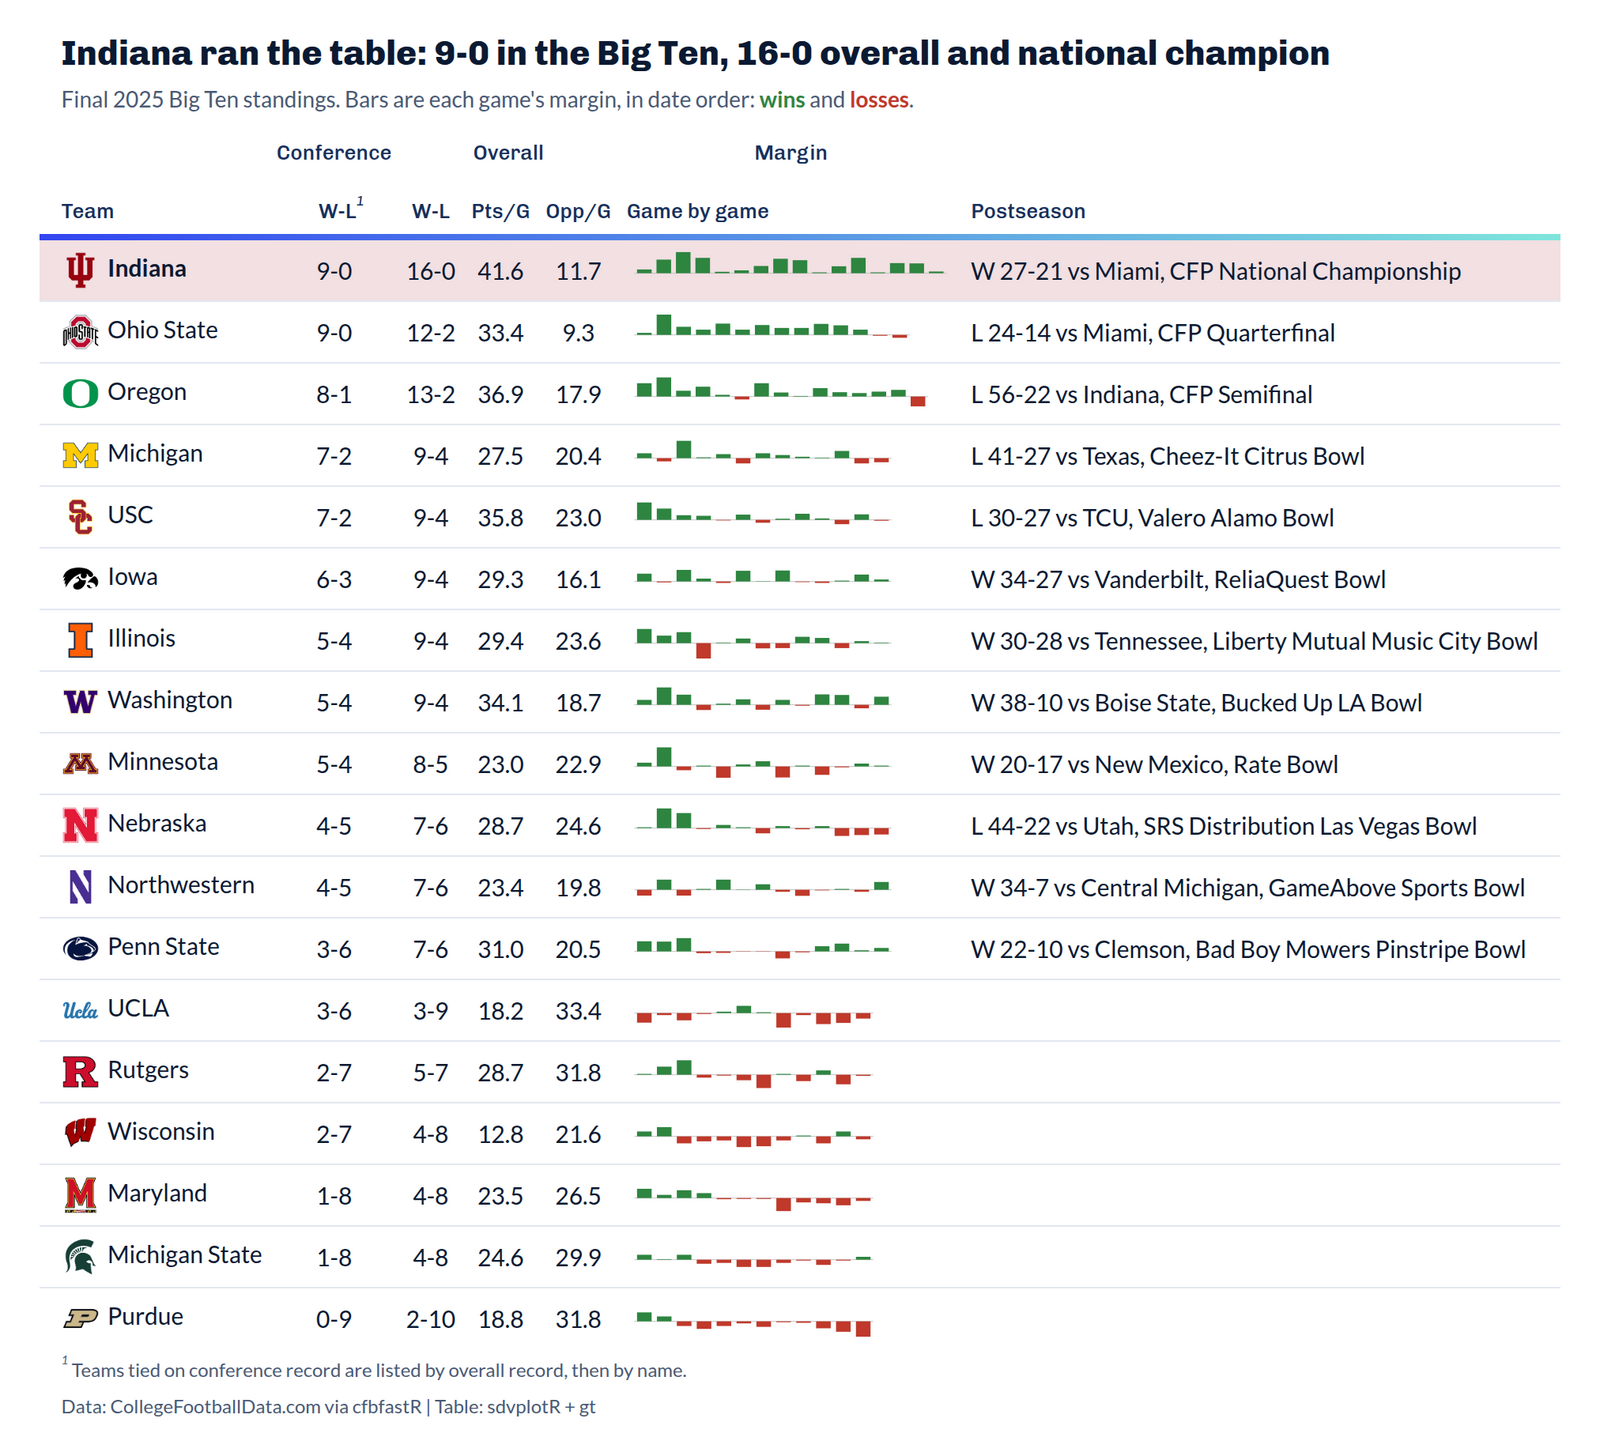 Recipe: CFB Conference Table
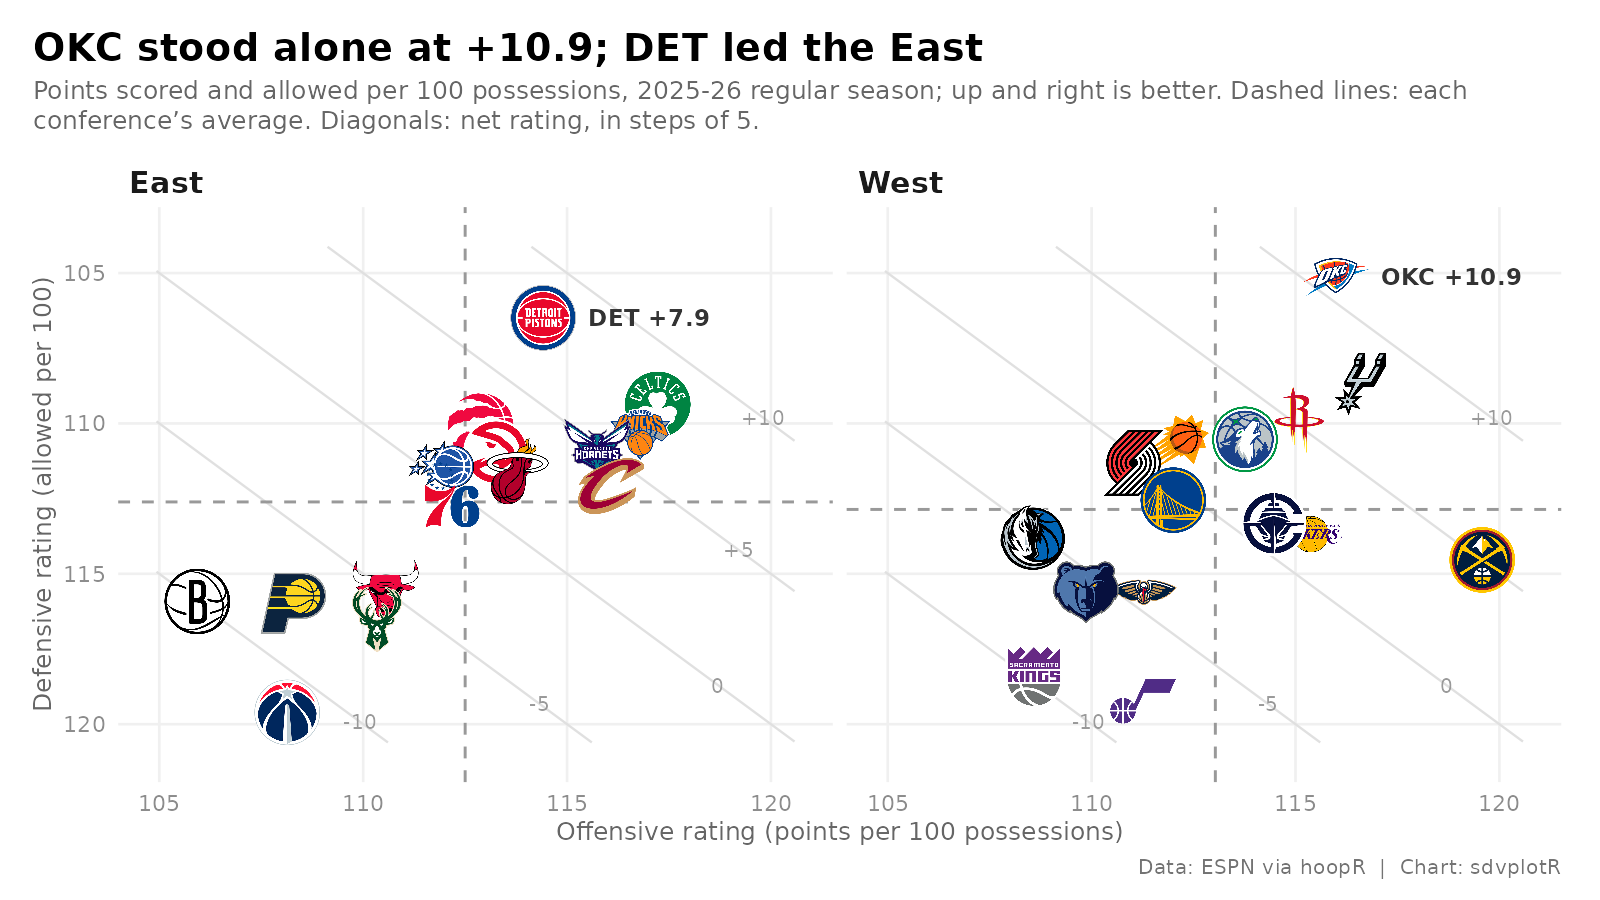 Recipe: NBA Net Rating Quadrant
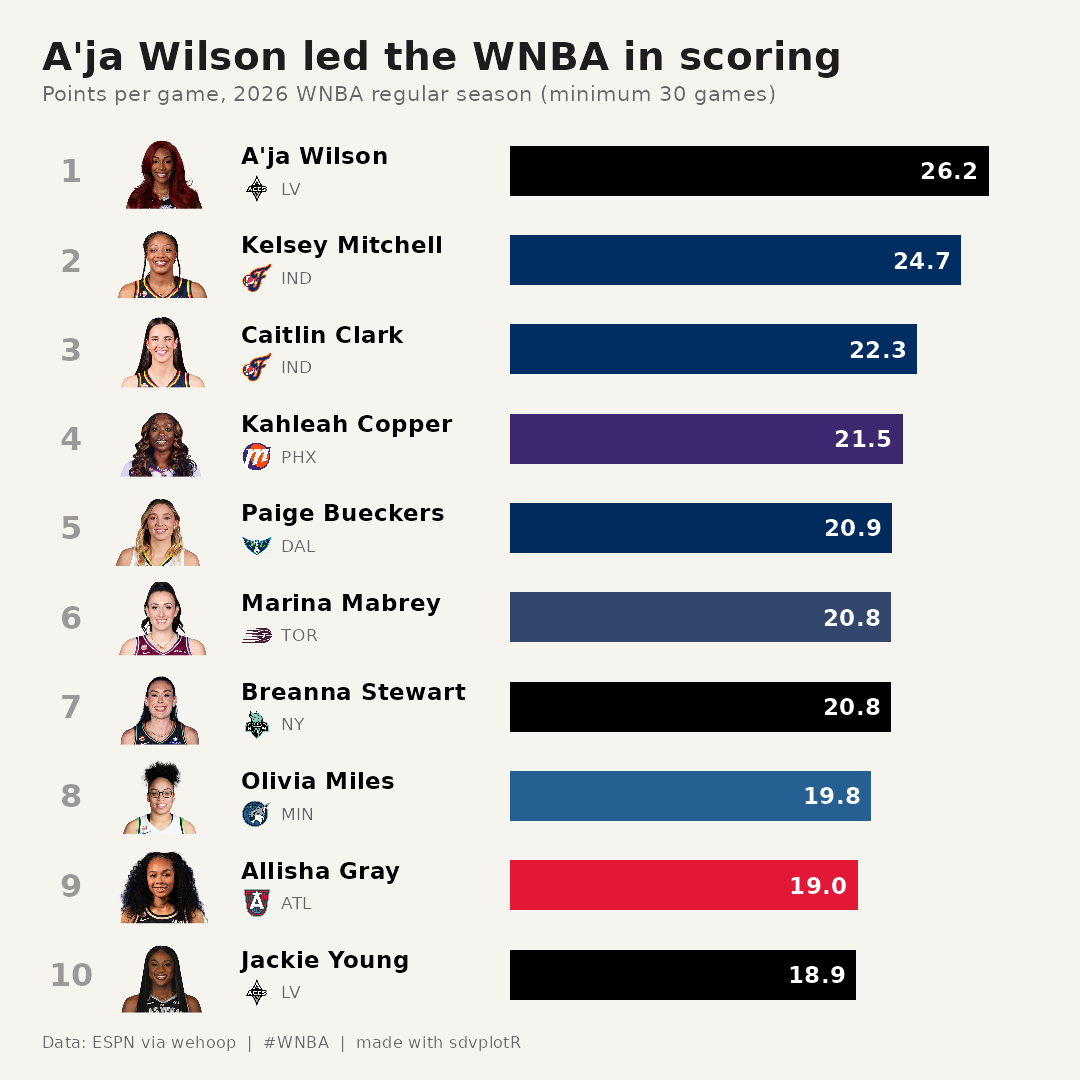 Recipe: WNBA Scoring Leaders Card
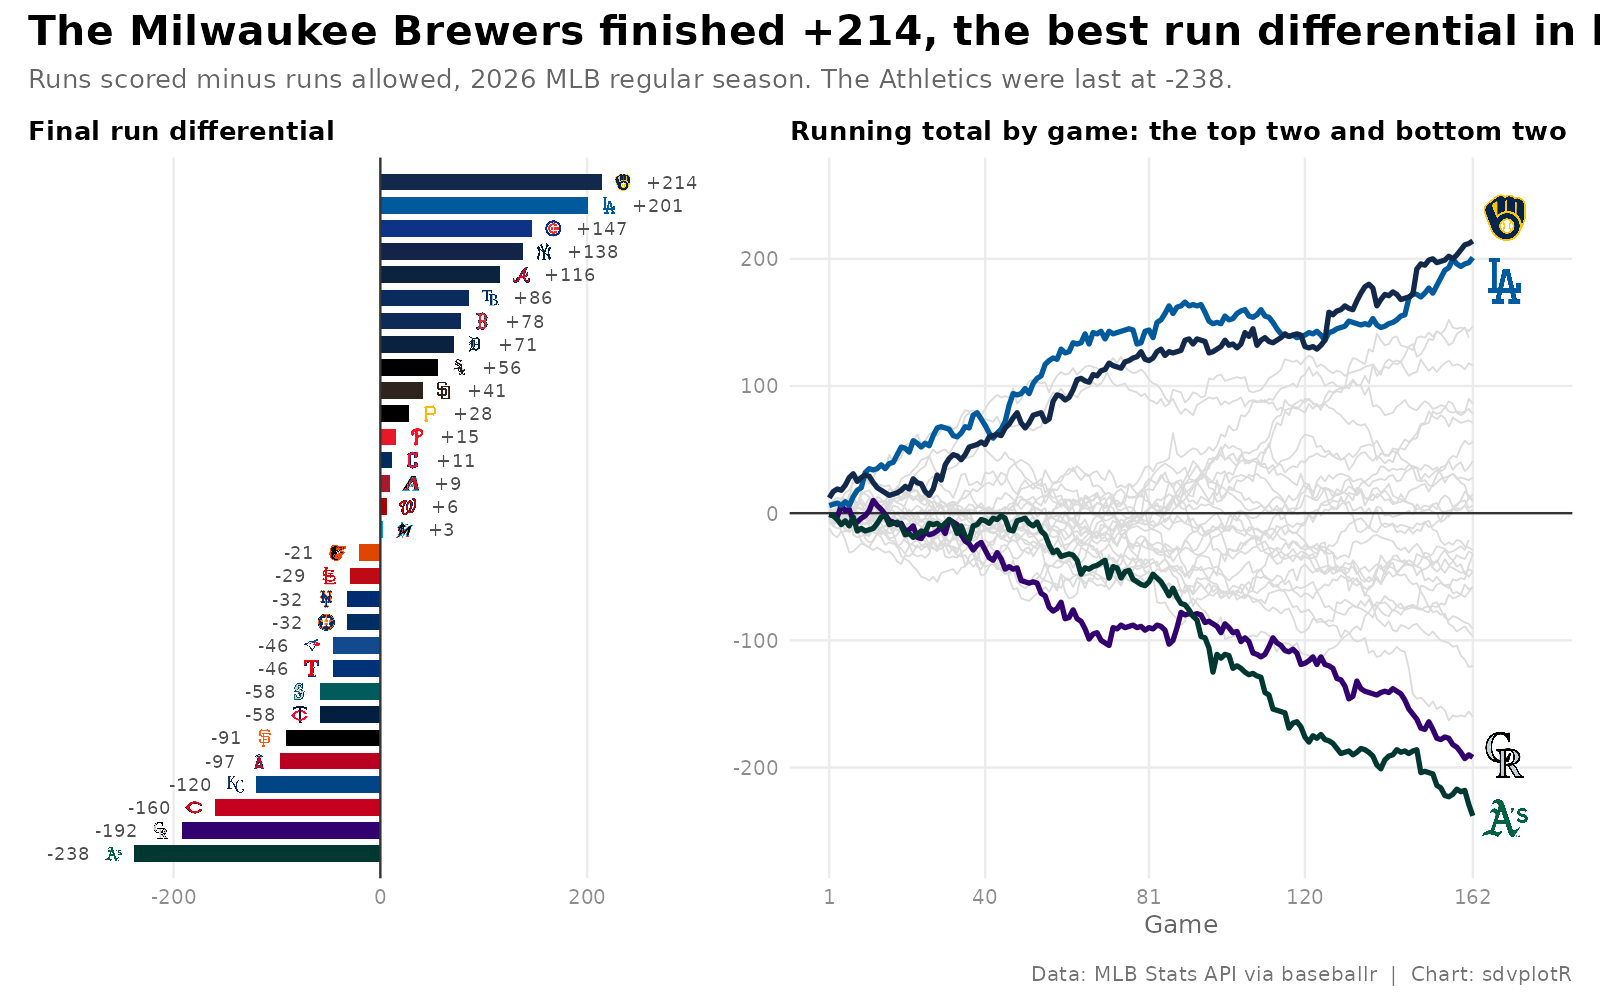 Recipe: MLB Run Differential
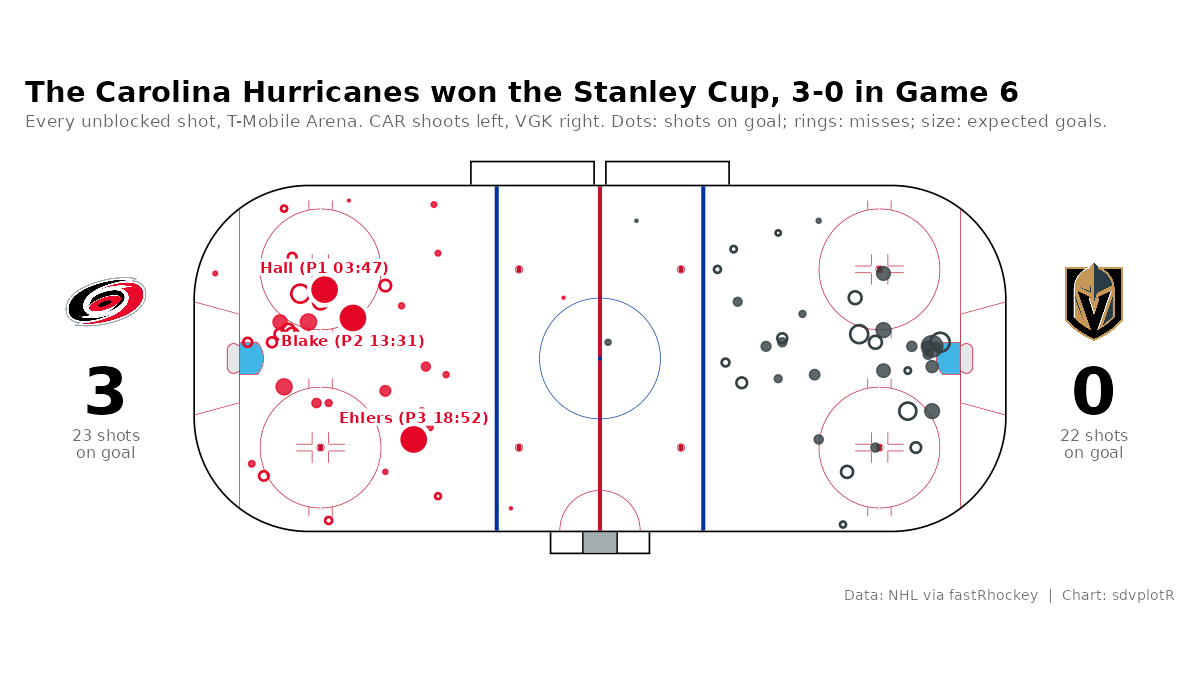 Recipe: NHL Shot Map
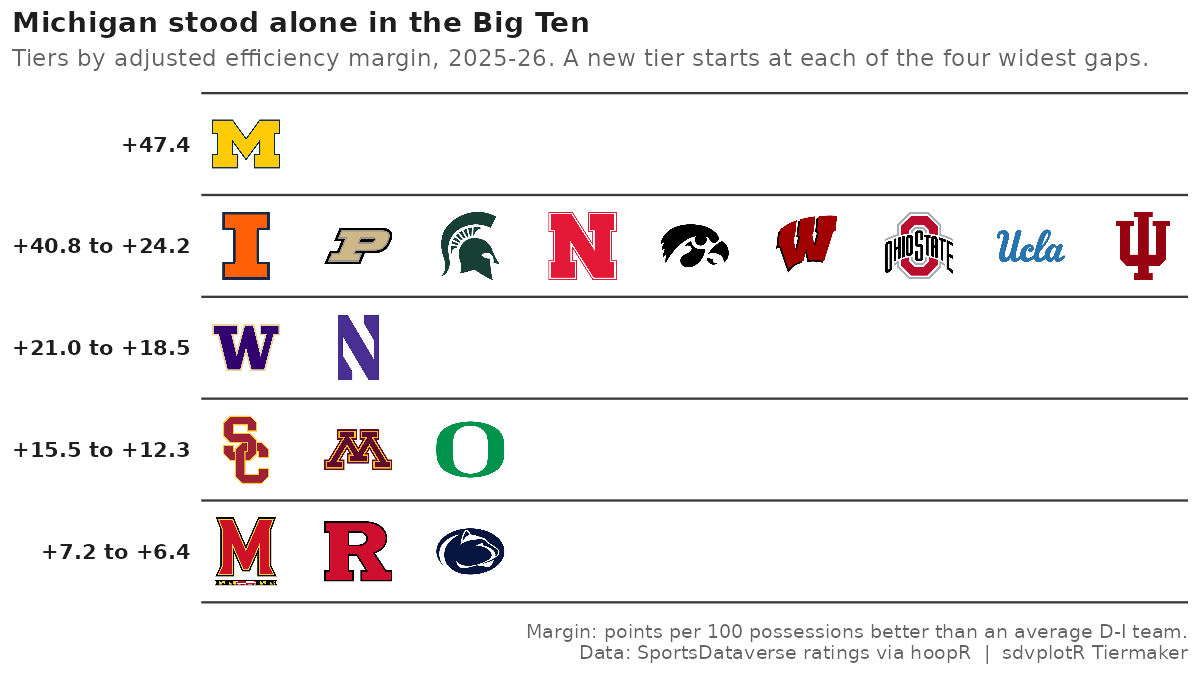 Recipe: College Hoops Tiers
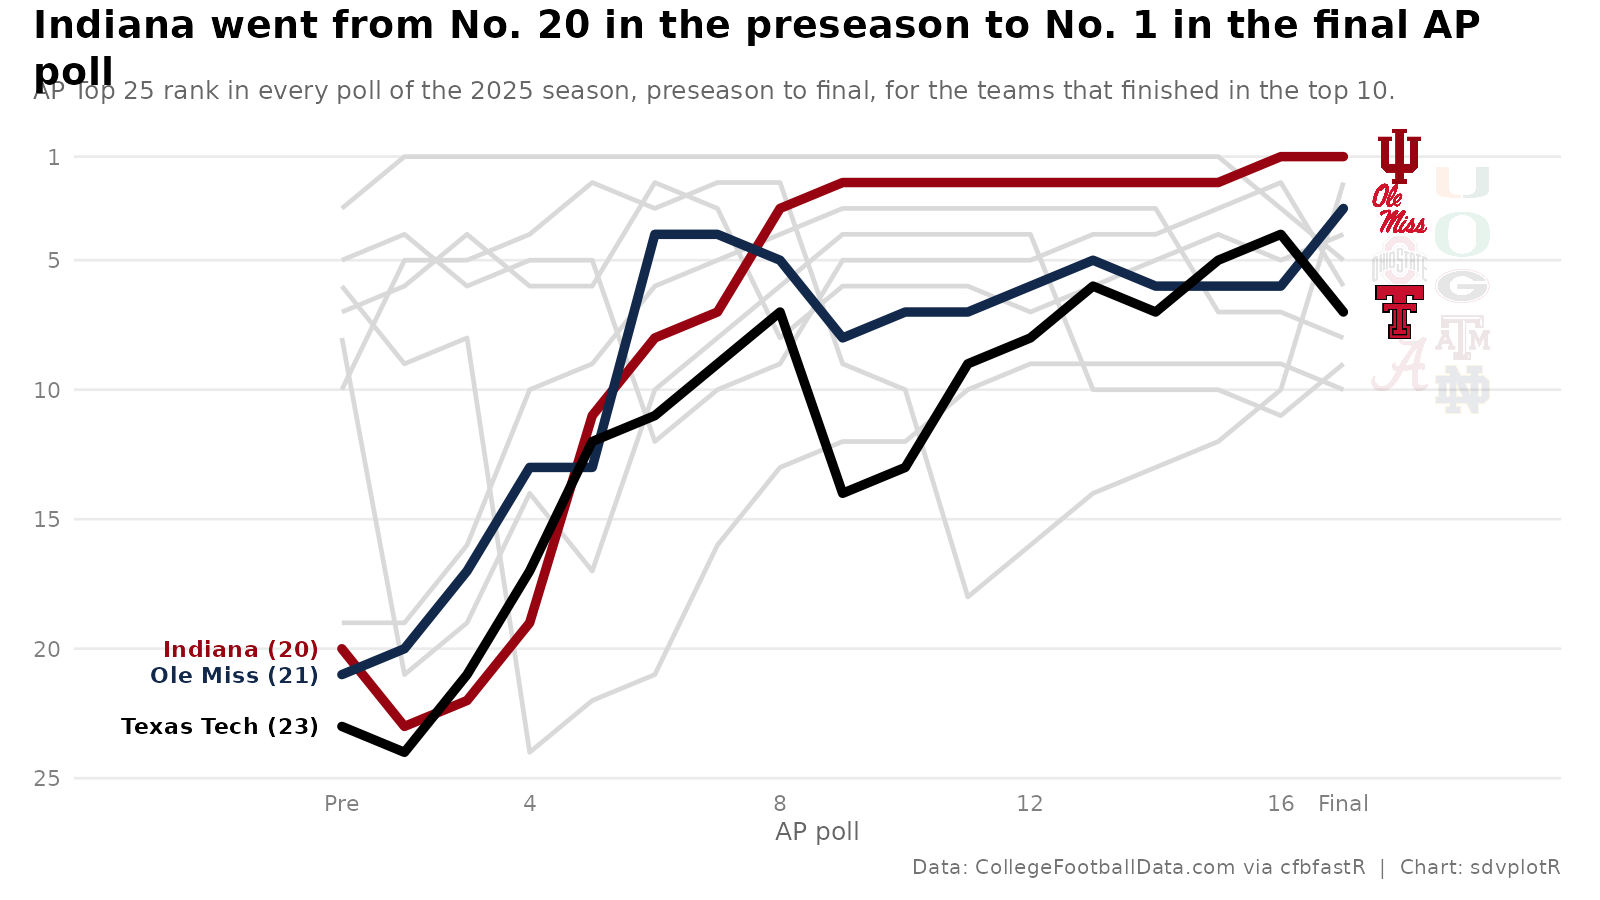 Recipe: Rank Bump Chart
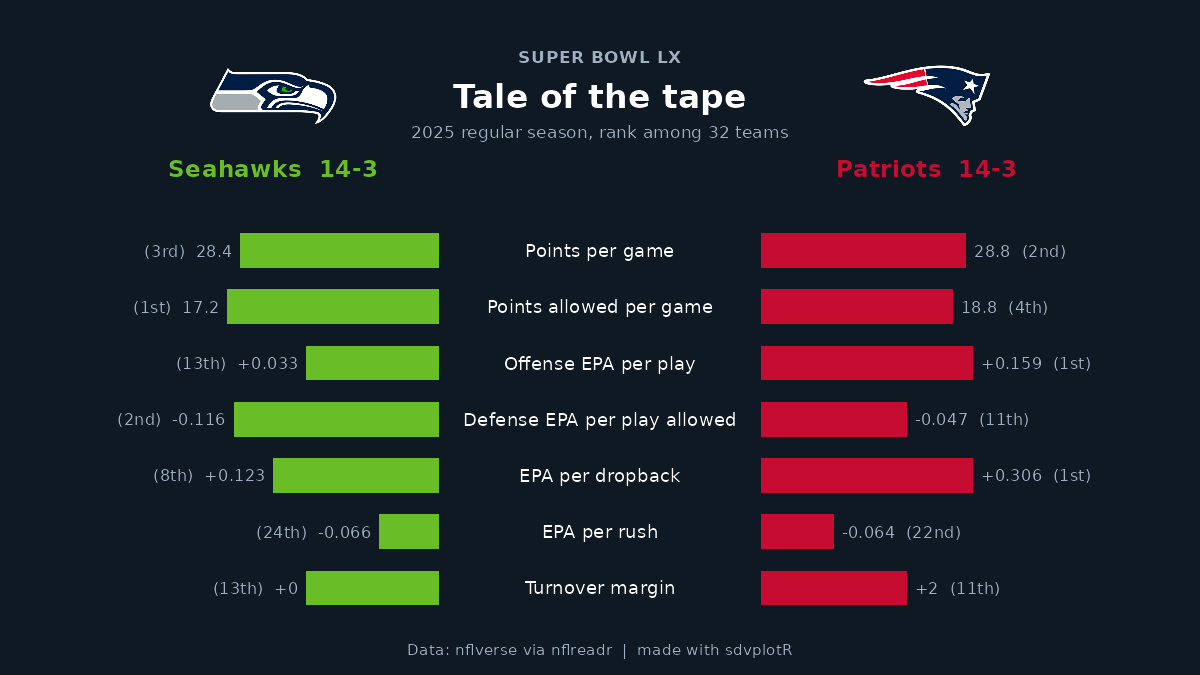 Recipe: Head-to-Head Card
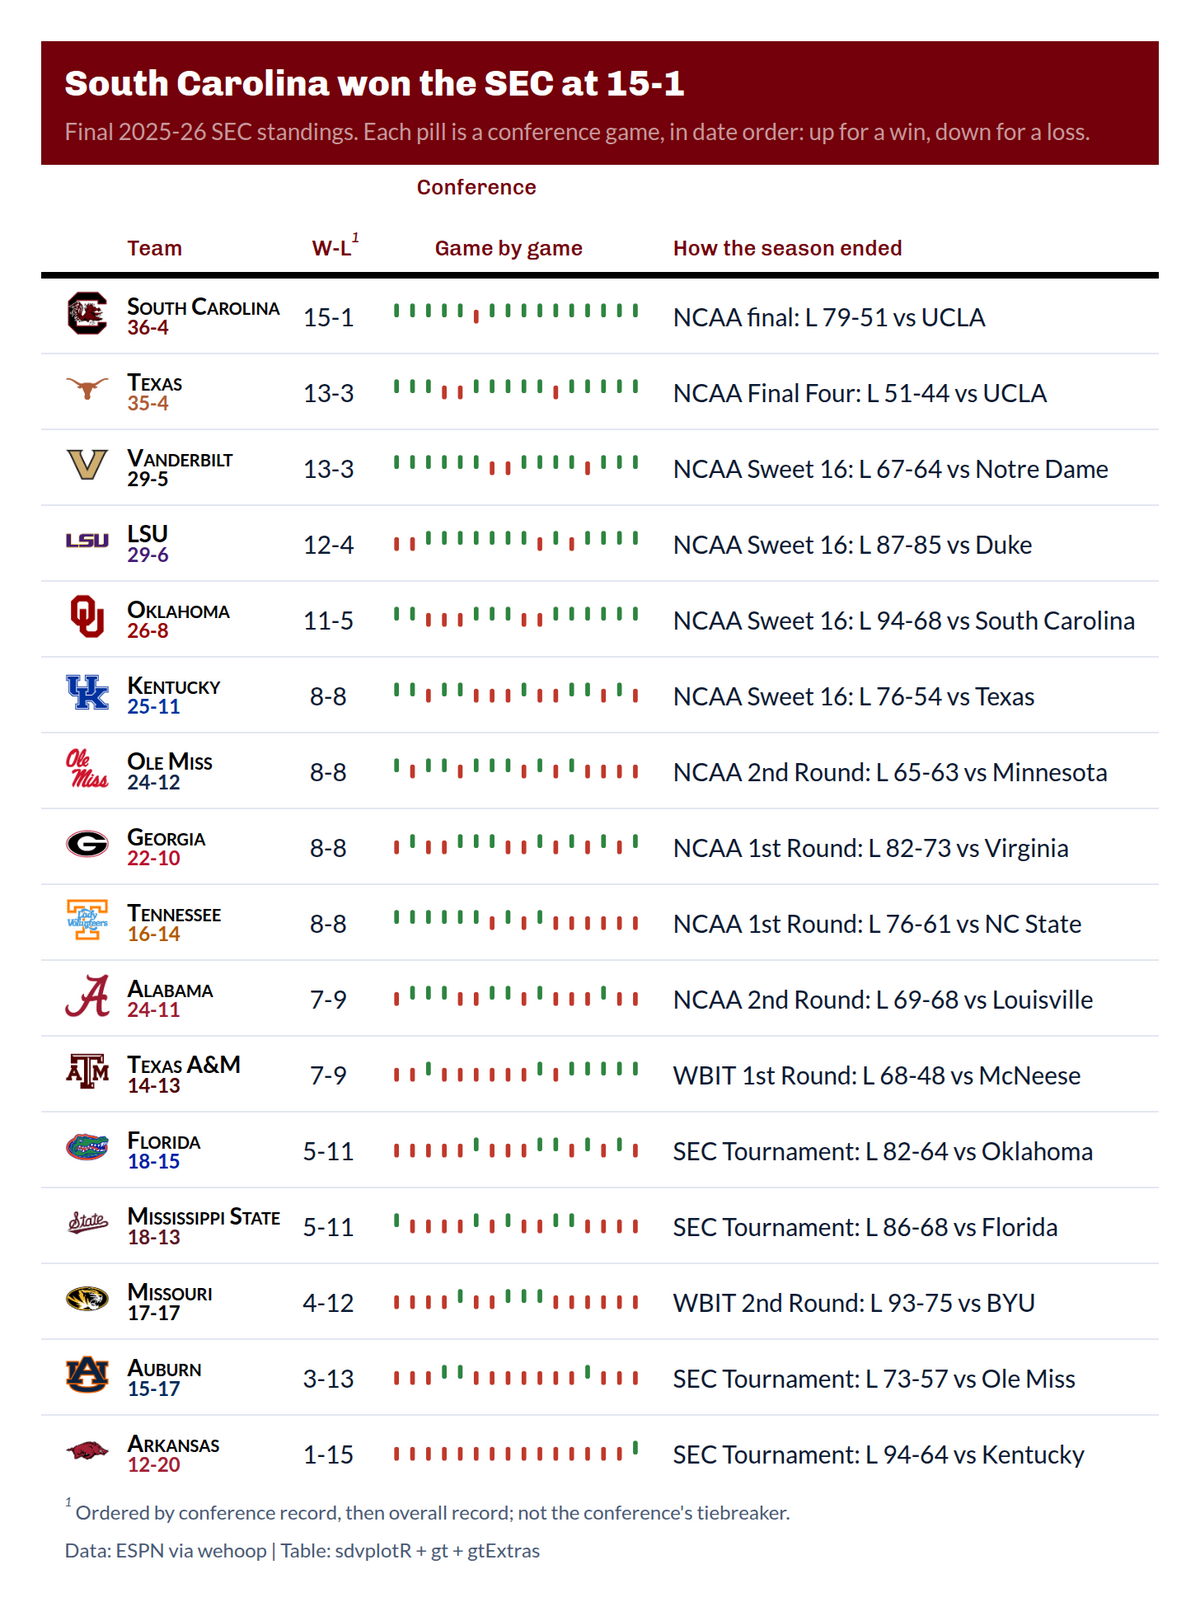 Recipe: WBB Conference Standings
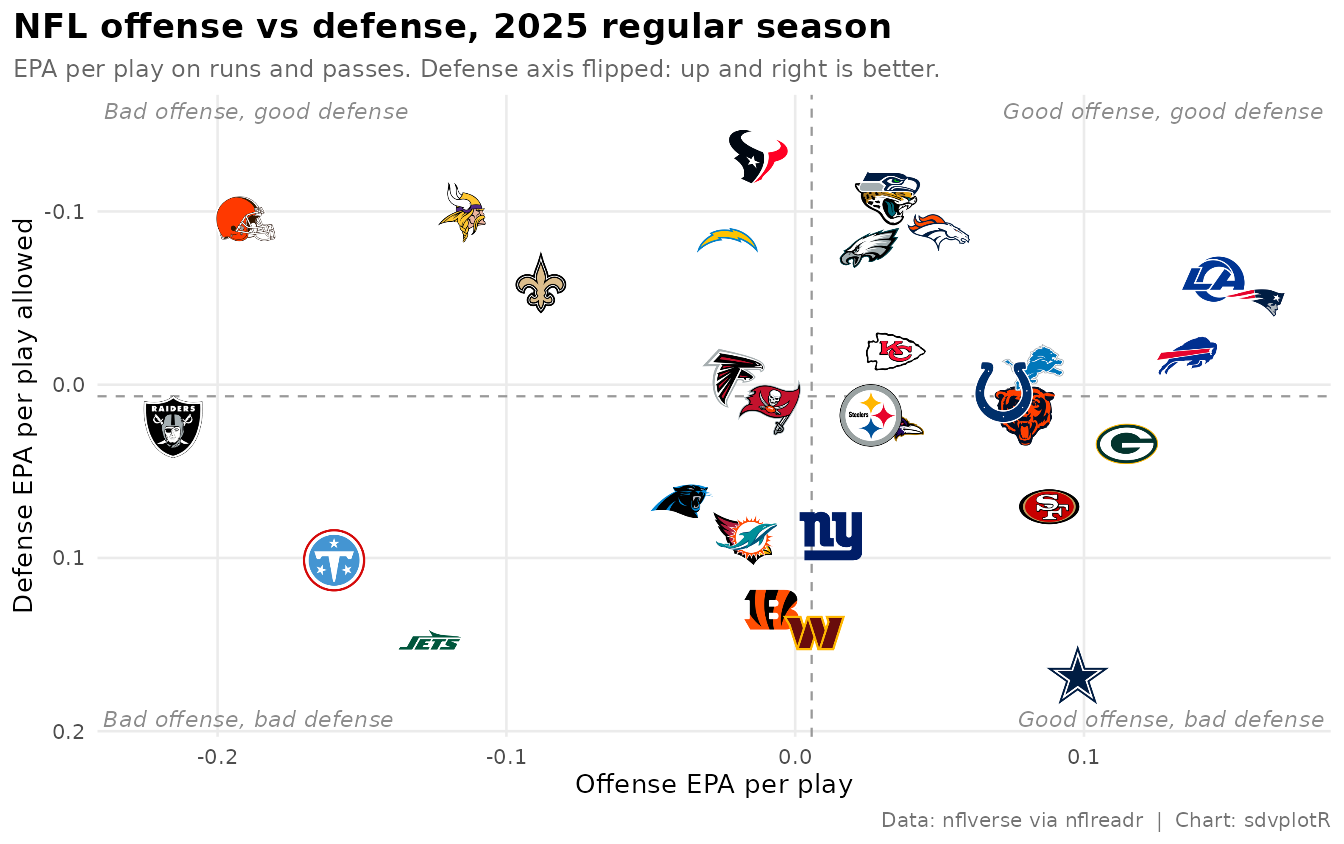 Recipe: Interactive NFL EPA Scatter
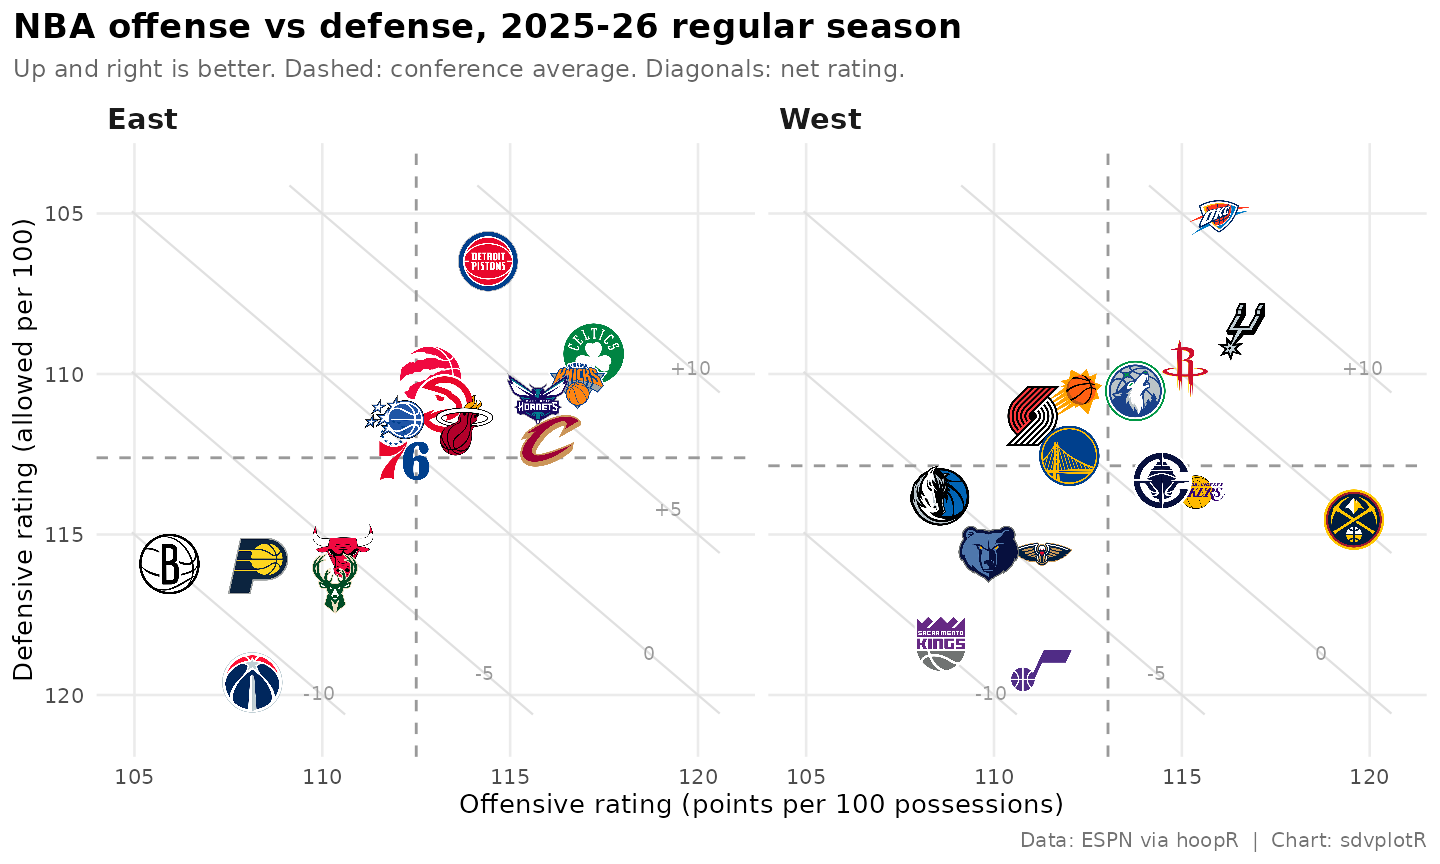 Recipe: Interactive NBA Net Rating
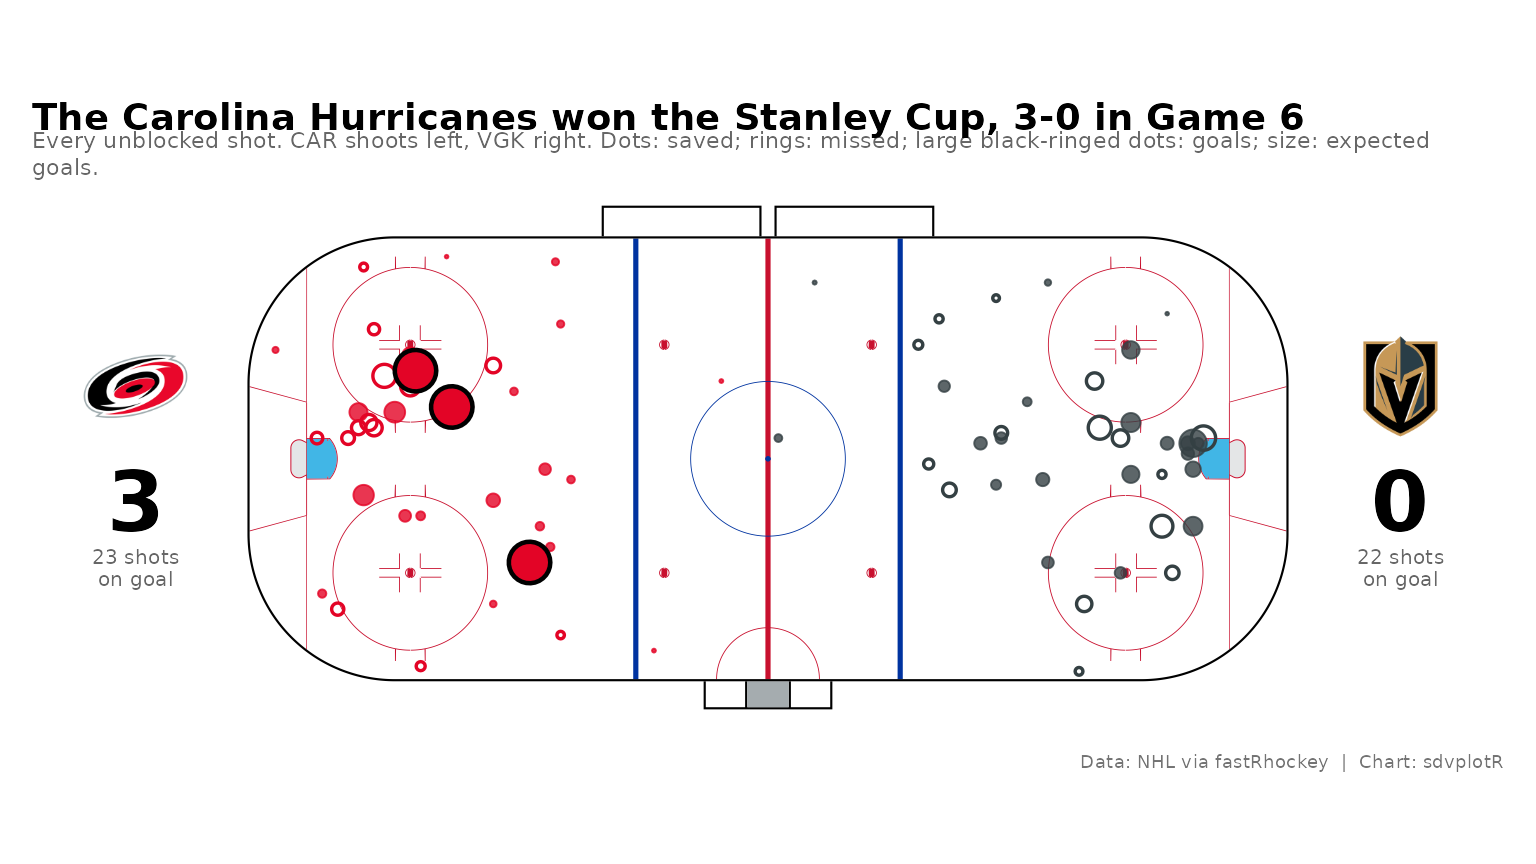 Recipe: Interactive NHL Shot Map
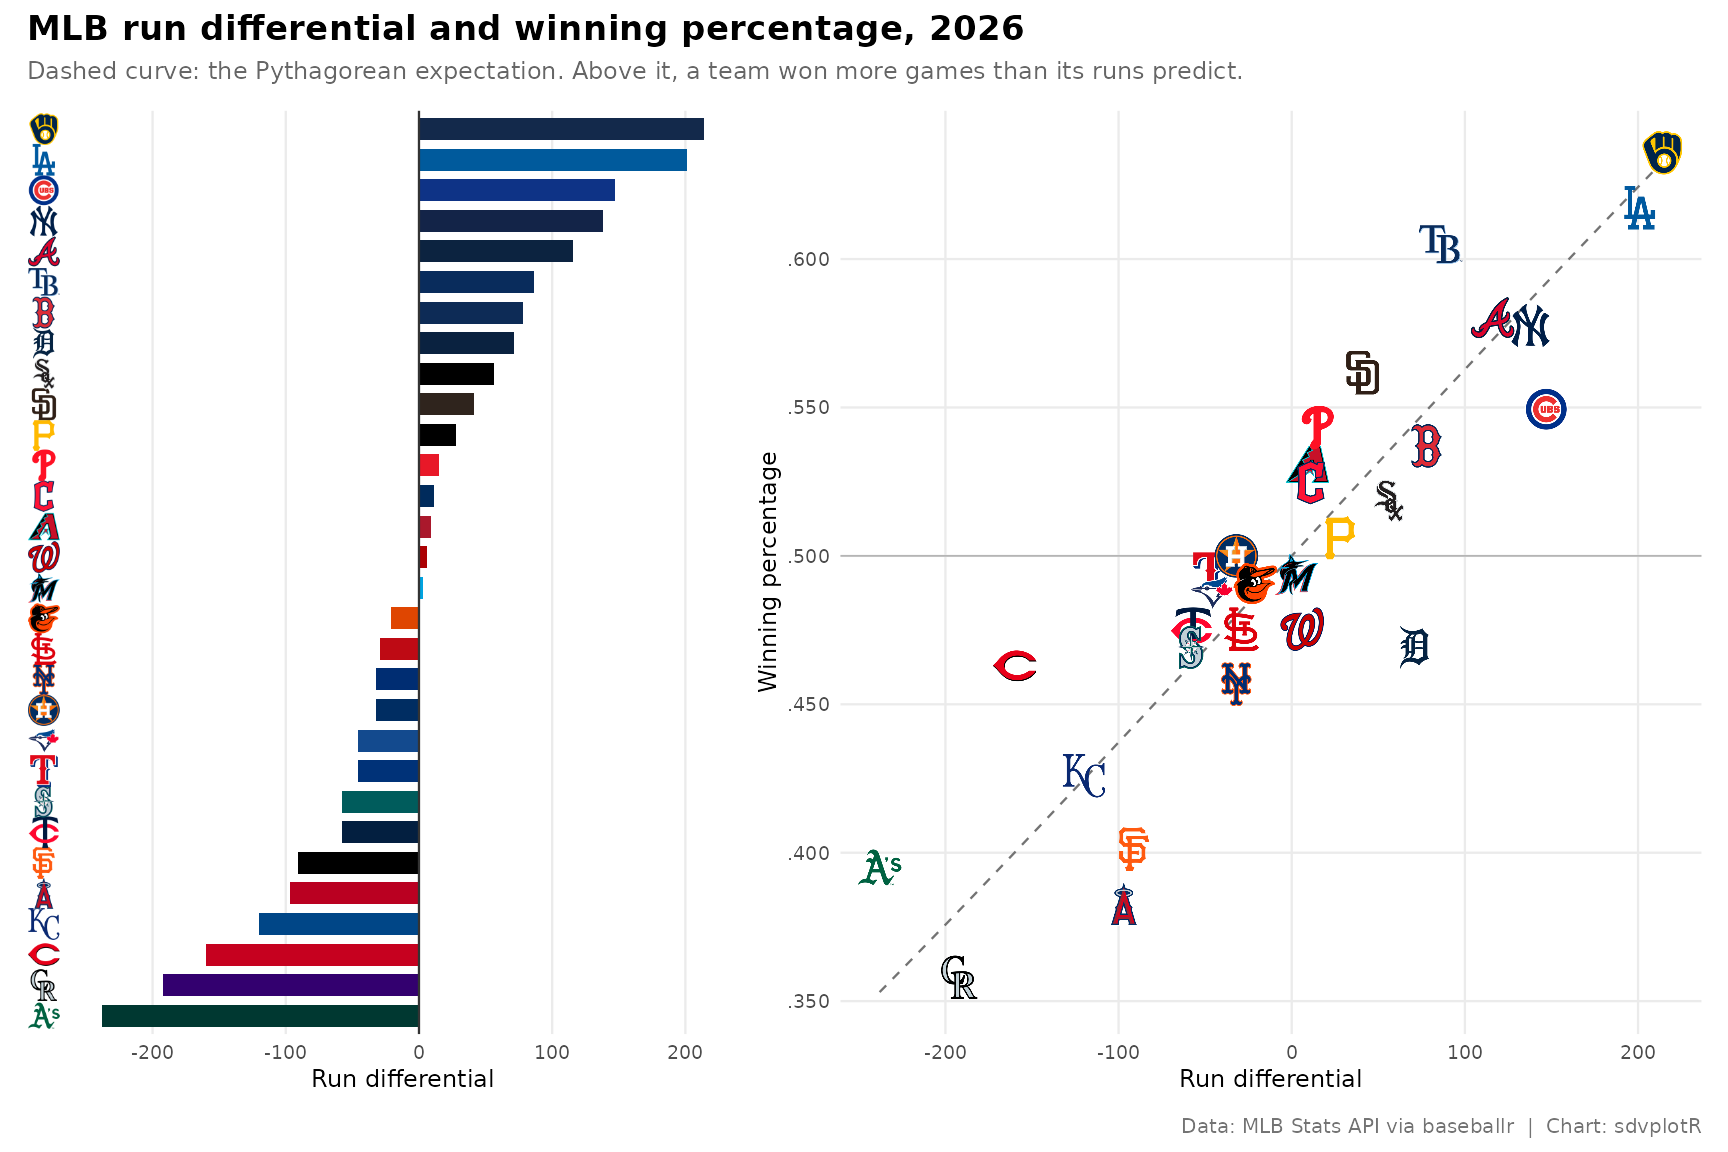 Recipe: Interactive MLB Run Differential
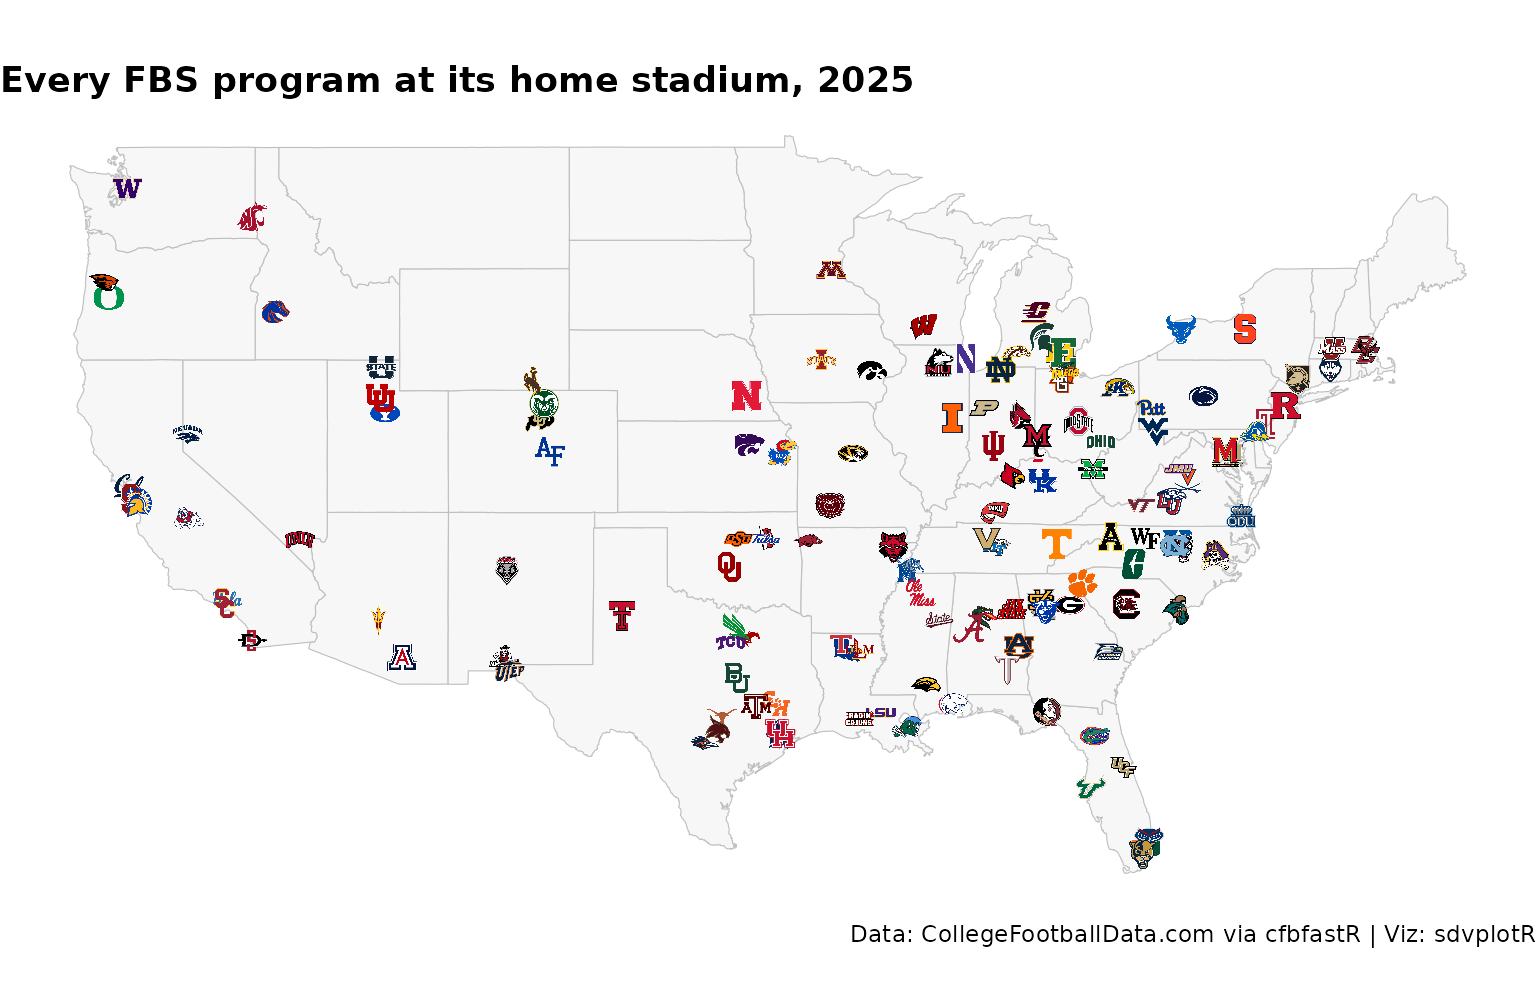 Recipe: CFB Stadium Map
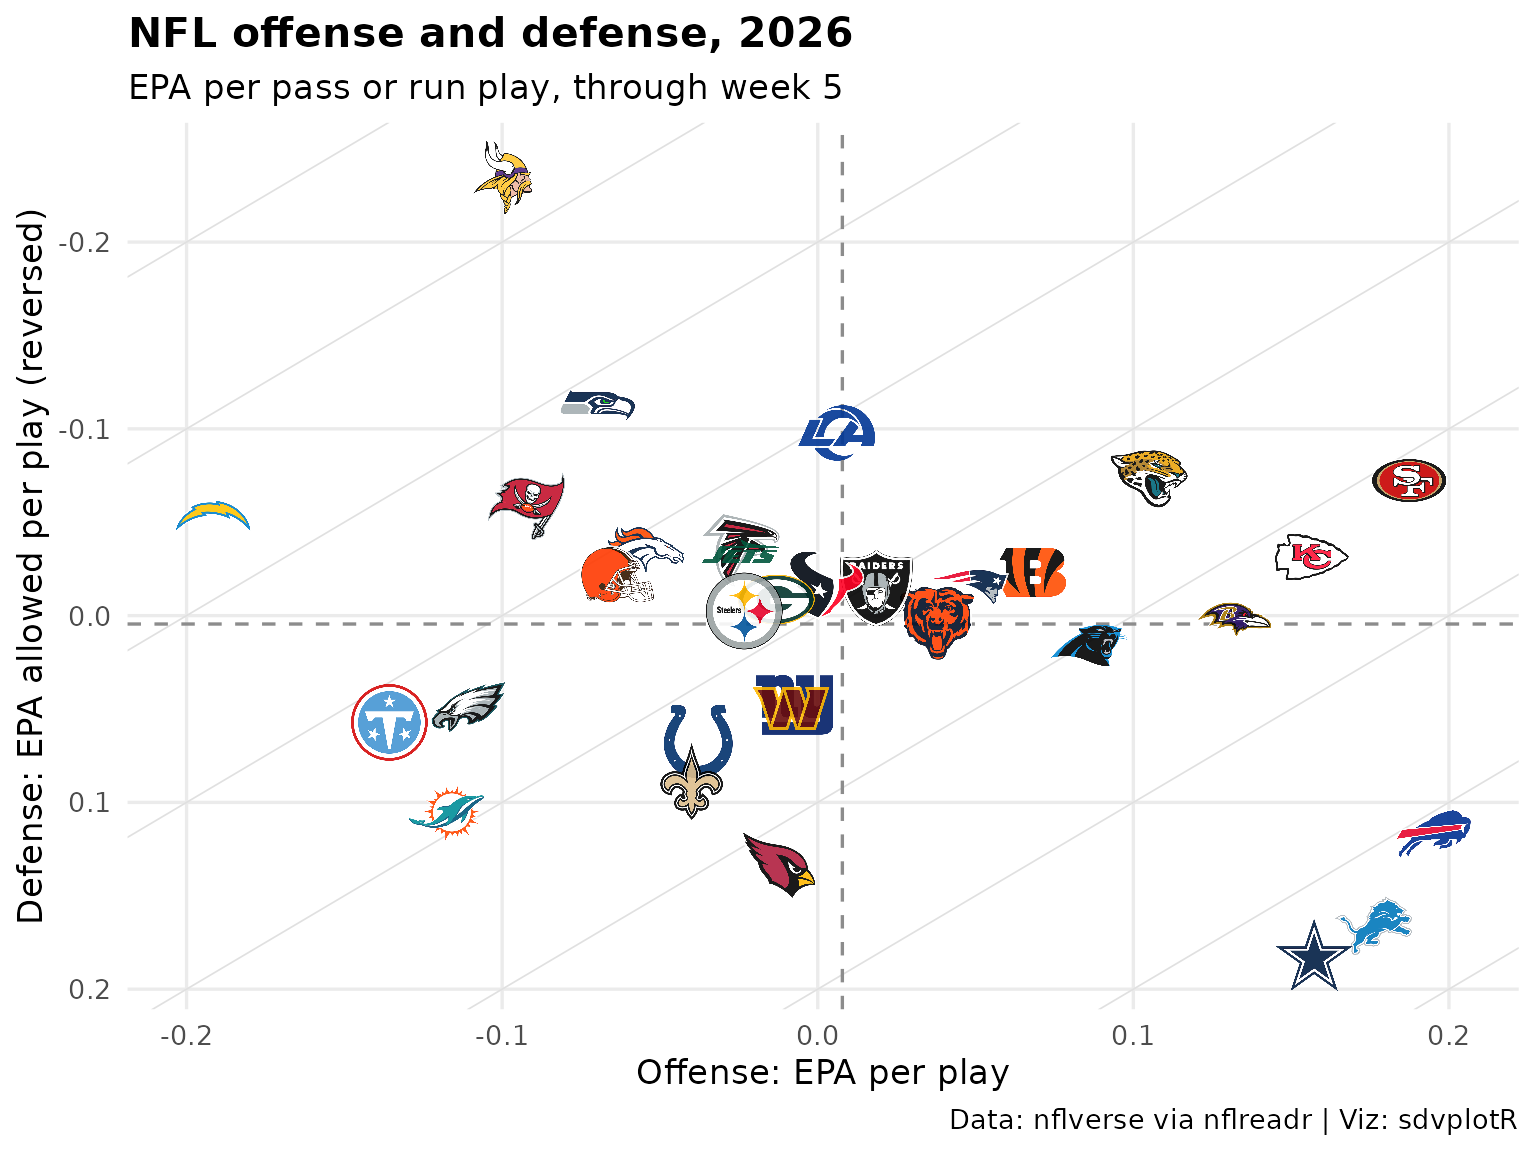 NFL Weekly Leaderboard
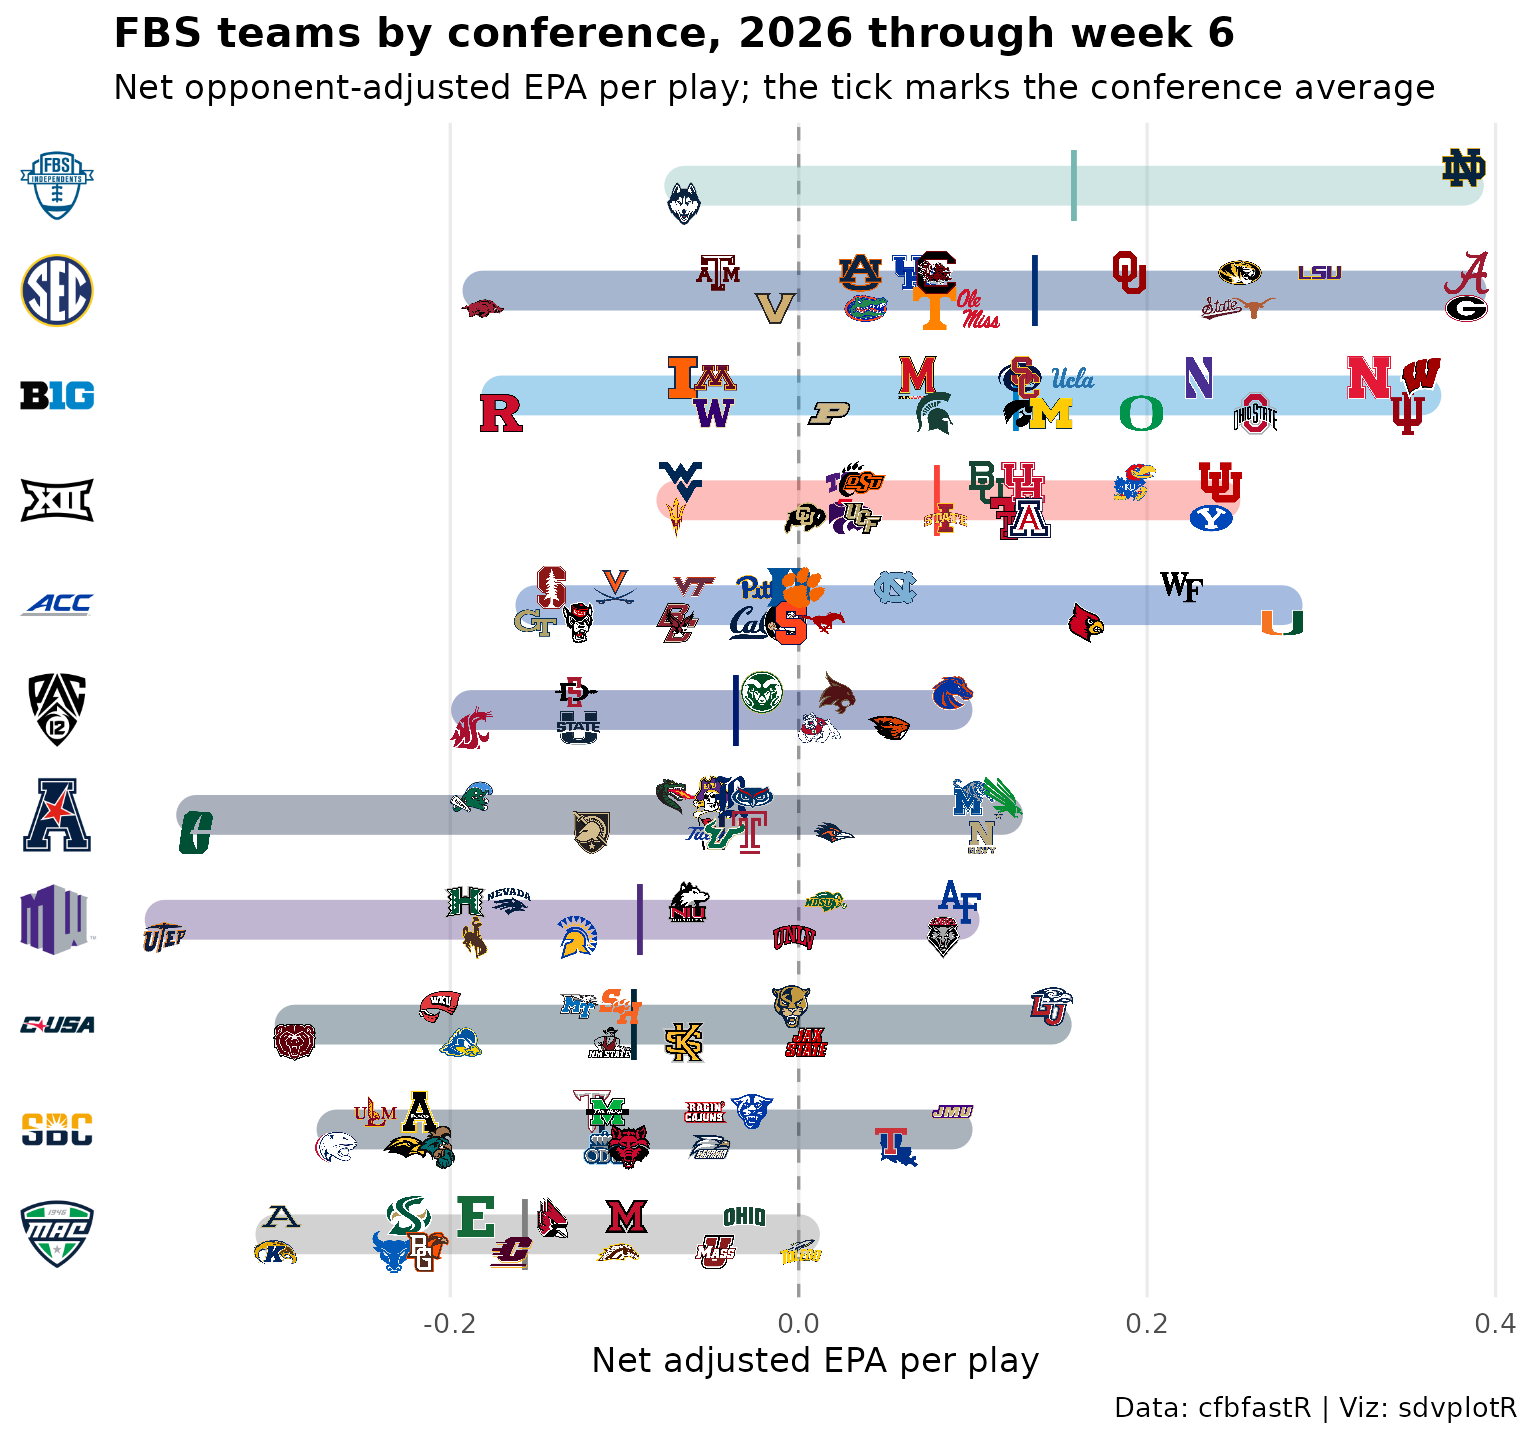 College Football Weekly Leaderboard
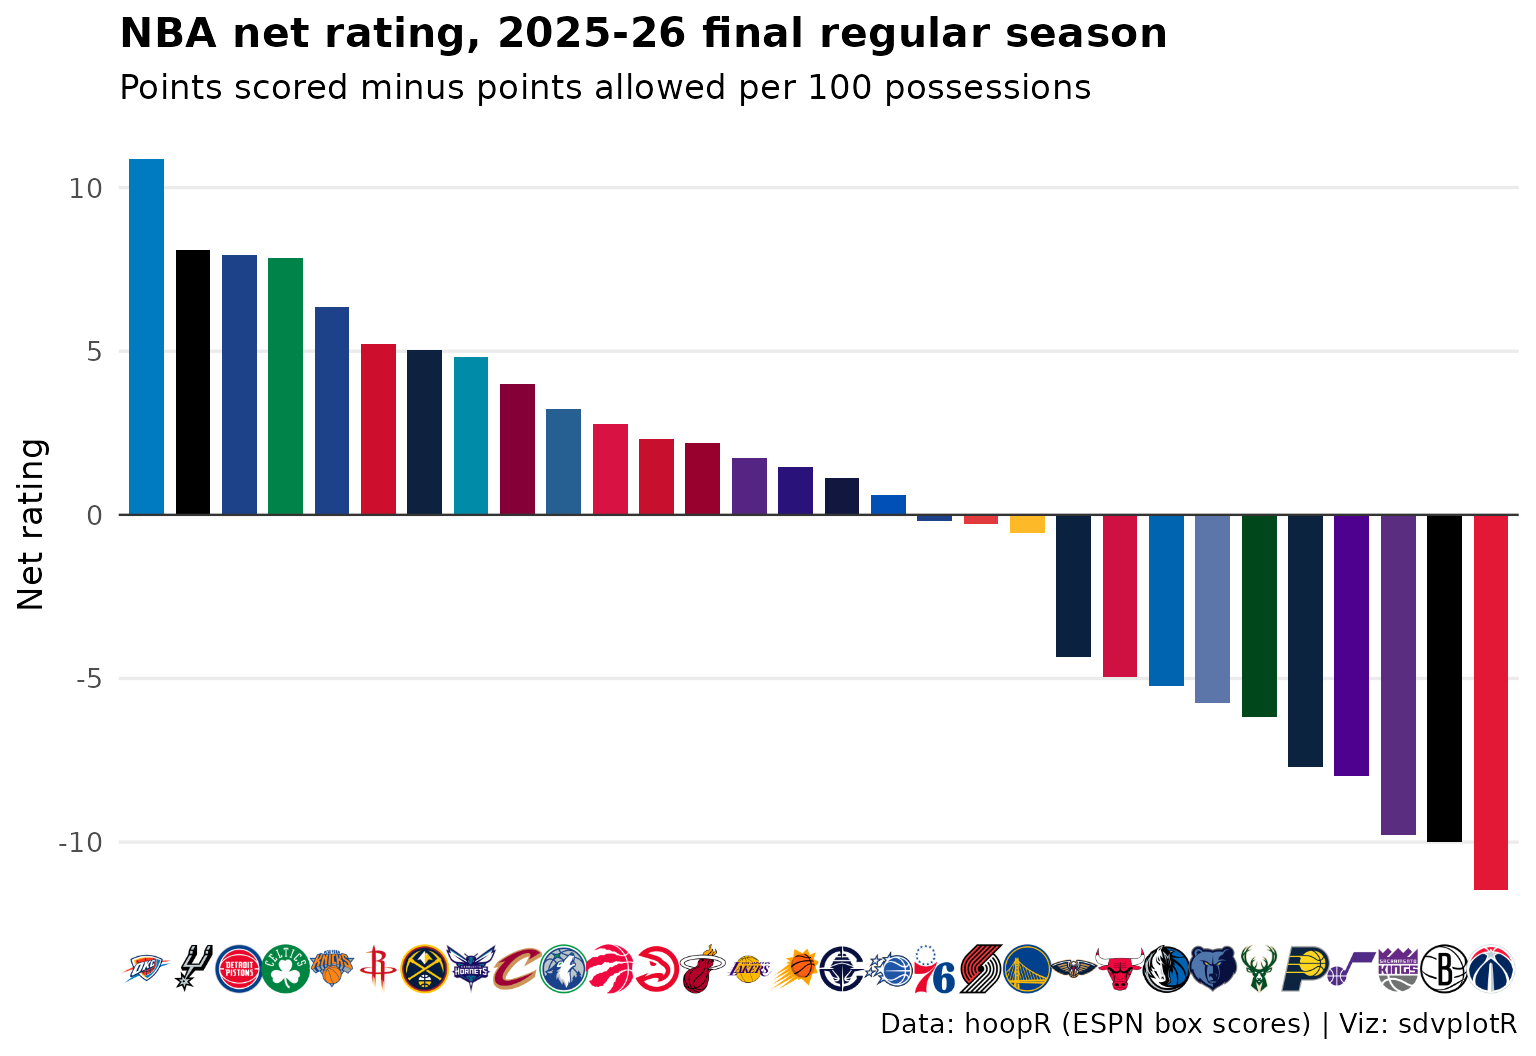 NBA Leaderboard
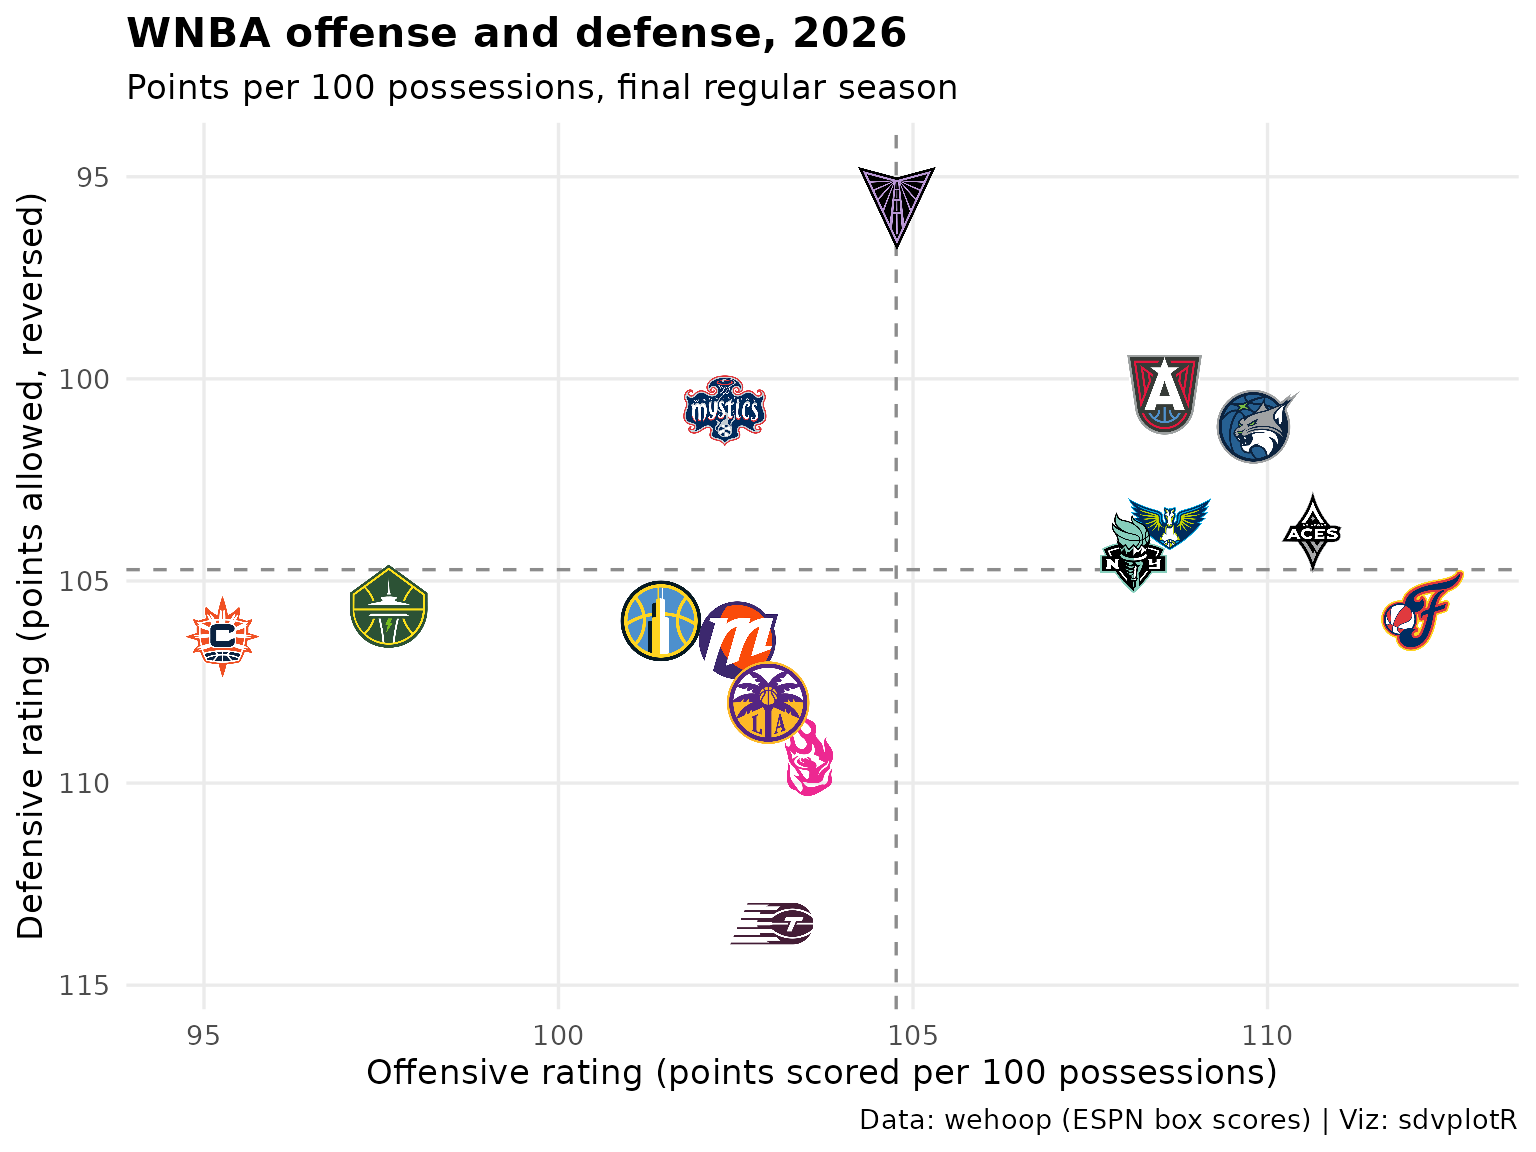 WNBA Leaderboard
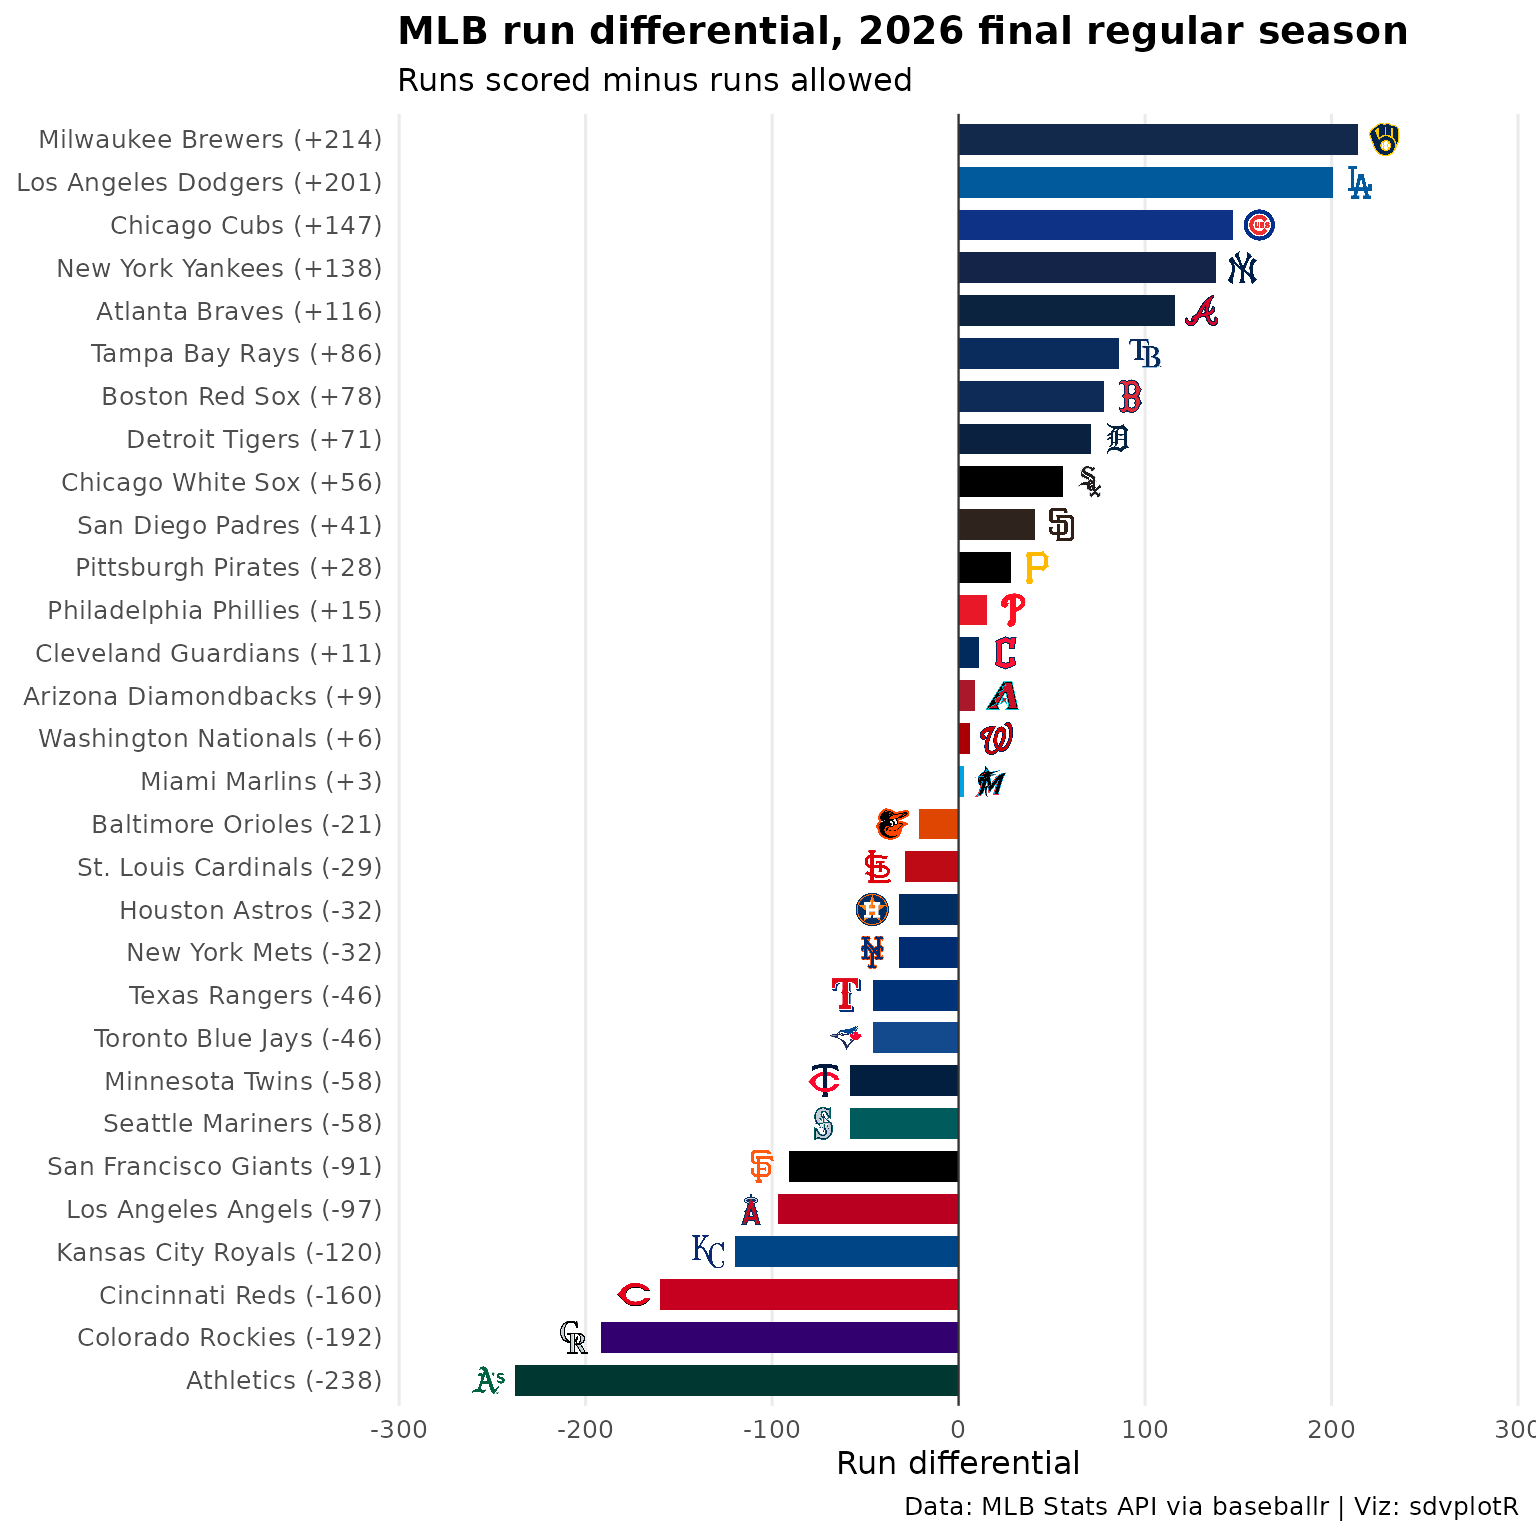 MLB Leaderboard
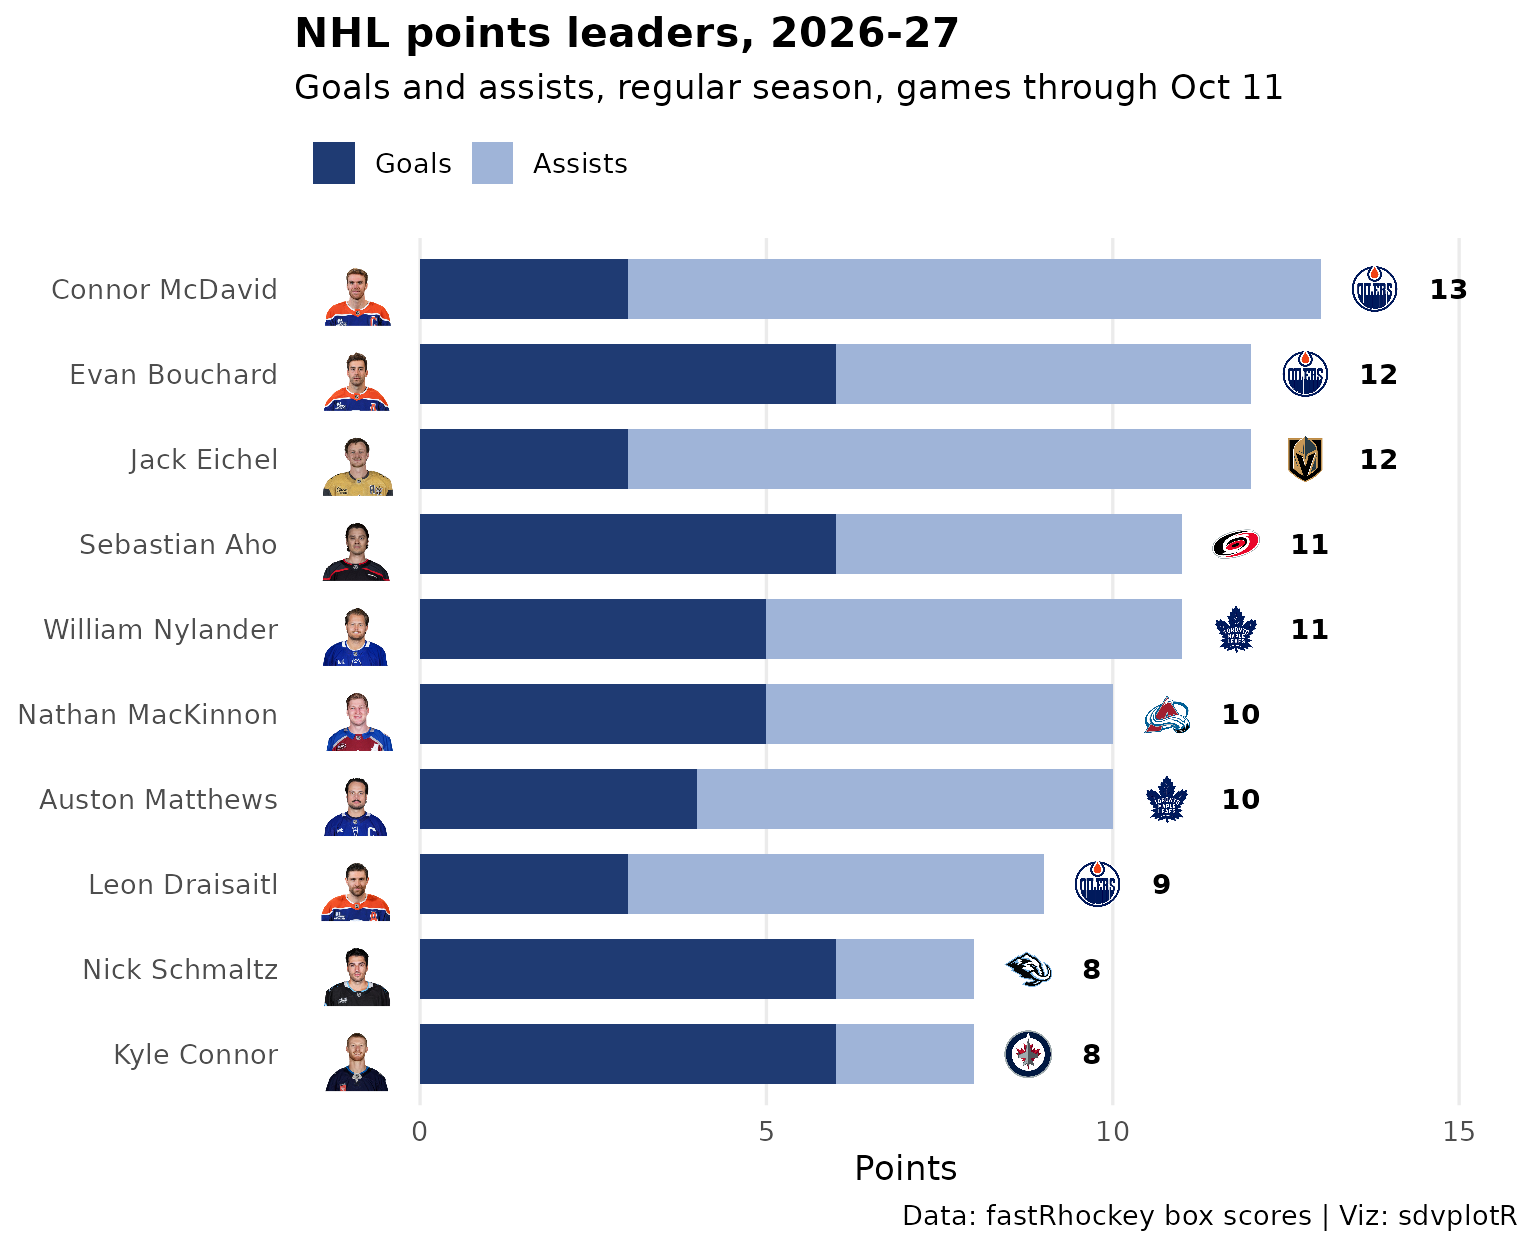 NHL Leaderboard
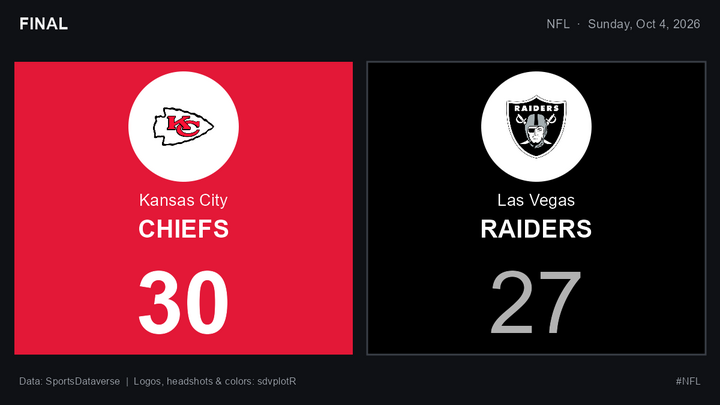 Social Graphics, Automated






Related SportsDataverse packages
- sdvplot - the Python plotting package
- sdvplot-js - the JavaScript / TypeScript plotting packages
- cfbfastR - college football
- hoopR - men’s basketball
- wehoop - women’s basketball
- baseballr - baseball
- fastRhockey - hockey
- oddsapiR - betting odds
- sportyR - playing surfaces
- sportsdataverse-py - the Python package
- sportsdataverse-R - the R meta-package