
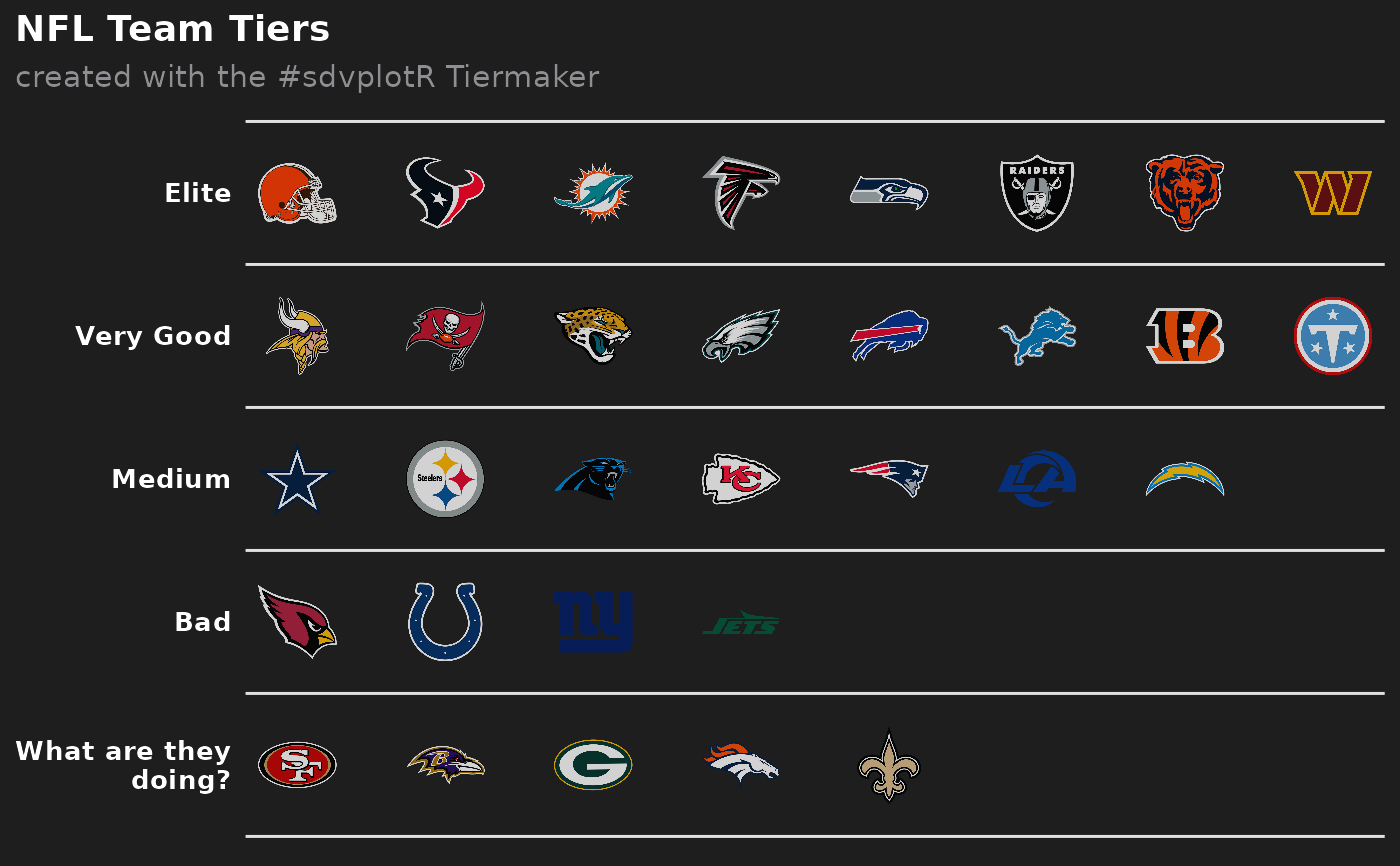
This function sets up a ggplot to visualize team tiers across any sport supported by sdvplotR. Teams are organized by performance or other metrics into labeled tiers.
Usage
sdv_team_tiers(
  data,
  sport = c("nfl", "nba", "wnba", "mlb", "nhl", "cfb", "mbb", "wbb"),
  title = glue::glue("{toupper(sport)} Team Tiers"),
  subtitle = glue::glue("created with the #sdvplotR Tiermaker"),
  caption = NULL,
  tier_desc = c(`1` = "Elite", `2` = "Very Good", `3` = "Medium", `4` = "Bad", `5` =
    "What are they doing?", `6` = "", `7` = ""),
  presort = FALSE,
  alpha = 0.8,
  width = 0.075,
  no_line_below_tier = NULL,
  devel = FALSE
)
Arguments
- data
A data frame that must include the variables
tier_no(the number of the tier starting from the top tier no. 1) andteam(the team abbreviation).teamshould be one ofvalid_team_names(). If data includes the variabletier_rank, these ranks will be used within each tier. Otherwise, ifpresort = FALSE, the function will assume that data is already sorted and ifpresort = TRUE, teams will be sorted alphabetically within tiers.- sport
Character string identifying the sport.
- title
The title of the plot. If
NULL, it will be omitted.- subtitle
The subtitle of the plot. If
NULL, it will be omitted.- caption
The caption of the plot. If
NULL, it will be omitted.- tier_desc
A named vector of tier descriptions. Names must equal the tier numbers from
tier_no.- presort
If
FALSE(the default) the function assumes that the teams are already sorted within the tiers. Will otherwise sort alphabetically.- alpha
The alpha channel of the logos (transparency level).
- width
The desired width of the logo in
npc.- no_line_below_tier
Vector of tier numbers. The function won't draw tier separation lines below these tiers.
- devel
Determines if logos shall be rendered. If
FALSE(the default), logos will be rendered on each run. IfTRUEthe team abbreviations will be plotted instead of the logos. This is much faster and helps with plot development.
Examples
# \donttest{
library(sdvplotR)
library(ggplot2)
team_abbr <- valid_team_names("nfl")
team_abbr <- sample(team_abbr)
# Build the team tiers data
df <- data.frame(
tier_no = sample(1:5, length(team_abbr), replace = TRUE),
team = team_abbr
)
# Plot team tiers
sdv_team_tiers(df, sport = "nfl")
 # }
# }